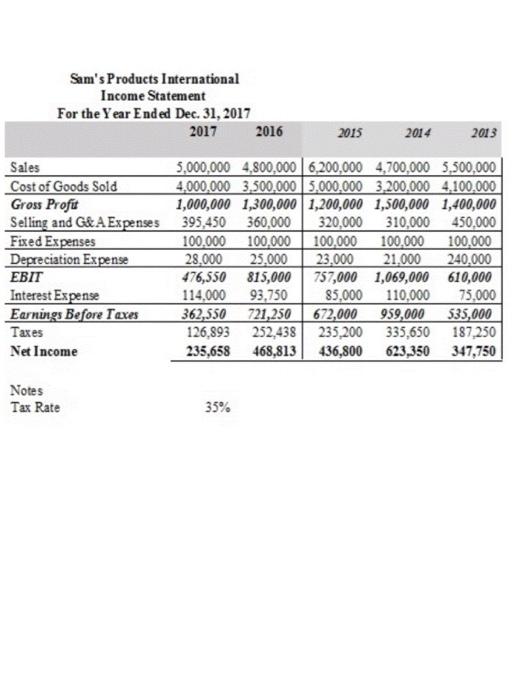
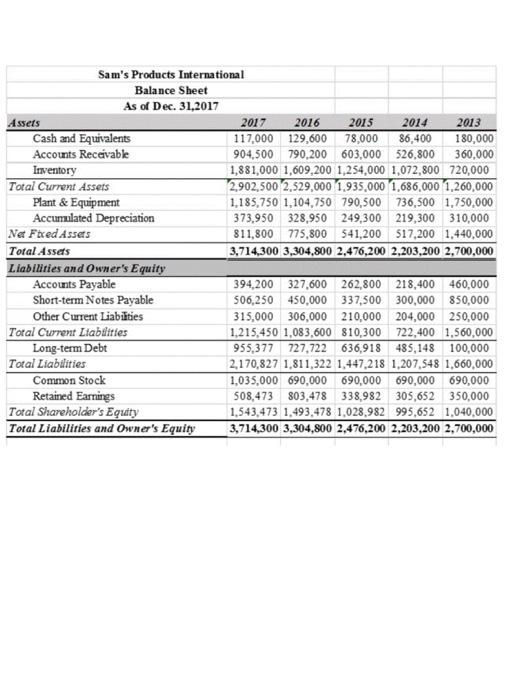
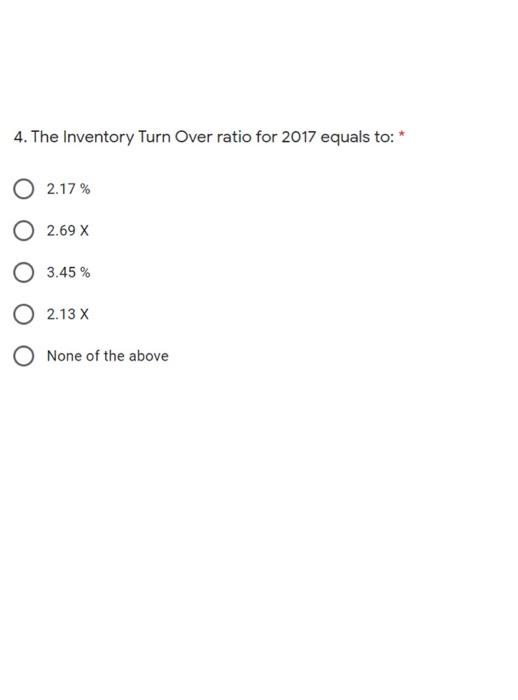
Sam's Products International Income Statement For the Year Ended Dec 31, 2017 2017 2016 2015 2014 2013 Sales Cost of Goods Sold Gross Profit Selling and G&A Expenses Fixed Expenses Depreciation Expense EBIT Interest Expense Earnings Before Texes Taxes Net Income 5,000,000 4,800,000 6,200,000 4,700,000 5,500,000 4,000,000 3,500.000 5.000.000 3.200.000 4.100.000 1,000,000 1,300,000 1,200,000 1,500,000 1,400,000 395,450 360,000 320,000 310,000 450,000 100.000 100,000 100.000 100.000 100,000 28.000 25.000 23.000 21.000 240.000 476,550 815,000 757,000 1,069,000 610,000 114,000 93,750 85,000 110,000 75.000 362,550 721,250 672,000 959,000 535,000 126,893 252,438 235,200 335,650 187,250 235,658 468,813 436,800 623,350 347,750 Notes Tax Rate 35% Sam's Products International Balance Sheet As of Dec. 31,2017 Assets 2017 2016 2015 2014 2013 Cash and Equivalents 117.000 129,600 78,000 86,400 180,000 Accounts Receivable 904,500 790,200 603,000 526,800 360,000 Inventory 1,881,000 1,609,200 1,254,000 1,072,800 720,000 Total Current Assers 2,902,500 2,329,000 1,935,000 1,686,000 1,260,000 Plant & Equipment 1,185,750 1,104,750 790,500 736,500 1.750,000 Accumulated Depreciation 373,950 328,950 249,300 219,300 310,000 Net Fired Assets 811,800 775,800 541,200 $17,200 1,440,000 Total Assets 3,714,300 3,304,800 2,476,200 2,203,200 2,700,000 Liabilities and Owner's Equity Accounts Payable 394,200 327,600 262,800 218,400 460,000 Short-term Notes Payable 506,250 450,000 337,500 300,000 850,000 Other Current Liabilities 315,000 306,000 210,000 204,000 250,000 Total Current Itabilities 1,215,450 1,083,600 810,300 722,400 1,560,000 Long-term Debt 955,377 727,722 636,918 485,148 100,000 Total Liabilities 2,170,827 1,811,322 1,447,218 1,207,548 1,660,000 Common Stock 1,035,000 690,000 690,000 690,000 690,000 Retained Earnings 508,473 803,478 338,982 305,652 350,000 Total Shareholder's Equity 1,543,473 1.493,478 1,028,982 995,652 1.040,000 Total Liabilities and Owner's Equity 3,714,300 3,304,800 2,476,200 2,203,200 2,700,000 4. The Inventory Turn Over ratio for 2017 equals to: * O 2.17% O 2.69 x O 3.45% 2.13 X None of the above


