Question
SAS Code Data Text File- (This is not complete but if you can give me the code without the long text file that would be
SAS Code


Data Text File- (This is not complete but if you can give me the code without the long text file that would be great! )THANKS
County Pct_Voted MedianAge MeanSavings Pct_Poverty PopulationDensity Gender Floyd, IA 47.59 37.9 134049 12.7 33.8 F Yellowstone, MT 35.72 33.5 87121 12.6 44.8 M Harney, OR 28.86 35.7 89645 12.8 0.7 M Crook, WY 21.17 33.4 113381 10.3 1.9 M Morrow, OR 33.79 33.6 54786 7.3 4 M Sullivan, TN 36.74 36.9 65711 16.1 354.7 M Caroline, VA 48.63 33.2 62698 14.6 37.6 F Christian, IL 51.4 36.3 117869 11.1 48.7 F Chickasaw, IA 43.87 35.7 173639 9.4 26.4 F Jackson, IA 47.51 35 131448 13 31.6 F Kent, DE 38.17 31.1 120322 13 196.4 M Cass, MO 34.26 32.3 57171 9.2 96.4 M Rio Grande, CO 34 33.7 52253 23 11.7 M Sheboygan, WI 37.7 33.8 83360 7.3 204.8 M Harford, MD 33.67 32.1 53662 6 442.6 F Laurens, SC 38.59 34 48839 16 82.7 M Fayette, TN 48.91 32.3 54592 25.1 37 M Marion, OR 37.28 33.7 74478 14.9 202.4 M Ford, KS 25.44 30.2 91769 15.7 25.3 F Wise, VA 51.7 33.9 89207 23 109.3 F Calhoun, TX 37.62 32.7 117404 17.8 39 M Kings, NY 70.7 32.3 100509 31.6 32360.3 M St. Johns, FL 30.74 37 81562 11.8 148.3 M Carroll, MD 28.12 33.3 91878 4.6 289.8 F Kenton, KY 30.76 31.8 65586 13.2 880.7 F Pickaway, OH 30.45 33 63444 13 100 M Sagadahoc, ME 36.88 32.7 52346 9.8 133.9 F Valley, MT 37.54 36.9 144304 16.2 1.7 M Walker, AL 50.22 35 74034 17.7 86.1 F Manitowoc, WI 38.54 34.6 87518 7.8 137.6 M Hall, NE 26.67 33.2 105915 11.4 91 M Mills, TX 37.84 42.8 200329 19.6 6 M Cumberland, PA 31.49 34.6 109677 6 365.3 M Stone, MS 34.38 30.9 71384 24.9 24.9 M Butte, CA 38.22 33.8 61001 19 115.5 M Oswego, NY 33.36 30.5 62279 13.5 130.5 M Daviess, MO 39.58 38 117797 19.5 13.8 M Morton, ND 31.19 33.1 86837 11.9 12.2 M Dent, MO 45.75 37.3 84592 22.5 18.2 M Davidson, NC 33.11 34.5 60795 11.6 235.1 M Nemaha, KS 28.12 35.6 210039 10.6 14.5 F Cache, UT 16.19 23.7 52568 11.4 62.9 F Hutchinson, SD 29.14 41.7 178275 12.8 10 M St. Mary's, MD 35.6 29.5 52532 8.9 220.3 F Christian, MO 36.41 32.6 62174 11.1 64.3 M Polk, WI 42.86 34.6 82488 11.8 38.8 M Jackson, AR 65.71 36.7 79717 23.9 29.8 M Lauderdale, AL 47.21 34.7 90707 13.9 122 F Mower, MN 49.16 37.4 90933 11.1 52.4 F De Witt, TX 31.6 37.3 147192 23.5 20.2 M Ashland, WI 50.2 33.7 79974 15.8 15.7 M Jackson, MN 39.68 36.9 106464 11.8 16.5 F Montgomery, TN 46.29 28.5 52112 14.5 204.6 M Louisa, IA 43.17 34.3 103034 11.6 28.4 F Lynn, TX 37.15 32.5 137461 27.1 7.5 M Valley, NE 27.64 39.7 169568 11.3 8.8 M Lafayette, LA 39.83 29.8 78322 18.4 633.6 F Izard, AR 61.18 43.9 97572 21.1 20.3 M Chatham, GA 43.75 32.2 87632 20 504.1 F Fayette, IN 37.06 35.1 64018 13.1 121.9 F Yamhill, OR 35.5 32.8 50244 12.6 96.8 M Gladwin, MI 41.36 36.9 54485 20.1 45.2 F Caswell, NC 56.5 35.8 29028 16 48.6 M Mason, KY 44.07 35 106510 19.6 71.3 F Harrison, MO 37.66 41.4 189548 18.8 11.6 M Pipestone, MN 34.29 36 125049 11.8 22.5 F Dona Ana, NM 44.99 27.9 47780 30 38.4 M Portsmouth, VA 54.3 31.7 54684 22 3148 F Lincoln, MN 42.77 41.4 71438 14 12.8 F Chester, PA 35.25 33.8 80772 6.4 512.3 M Hyde, SD 31.52 39.4 132841 14.5 2 M Madison, KY 40.35 28.8 68721 20.6 135 F Ouachita, LA 36.87 30.2 95503 25.1 237.5 F Webster, NE 27.59 43.8 131919 11.4 7.3 M Polk, NE 22.67 39.4 157607 6.9 12.5 M Angelina, TX 39.26 32.3 74790 18.5 89.8 M Freestone, TX 38.41 36.6 74974 18.6 17.7 M Cloud, KS 31.57 39.9 157533 12.8 15 F Schuylkill, PA 37.57 38.5 109391 10.7 198 M Starke, IN 42.19 33.3 63260 16.2 72.7 F
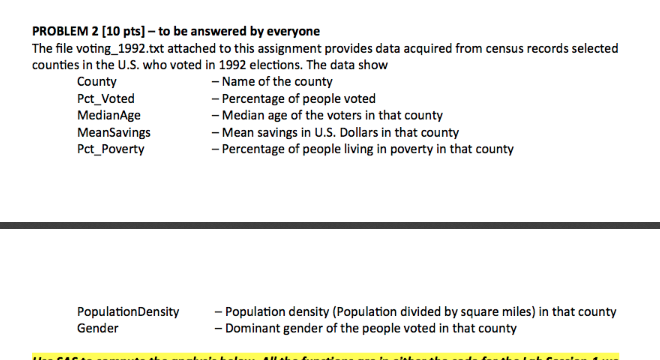
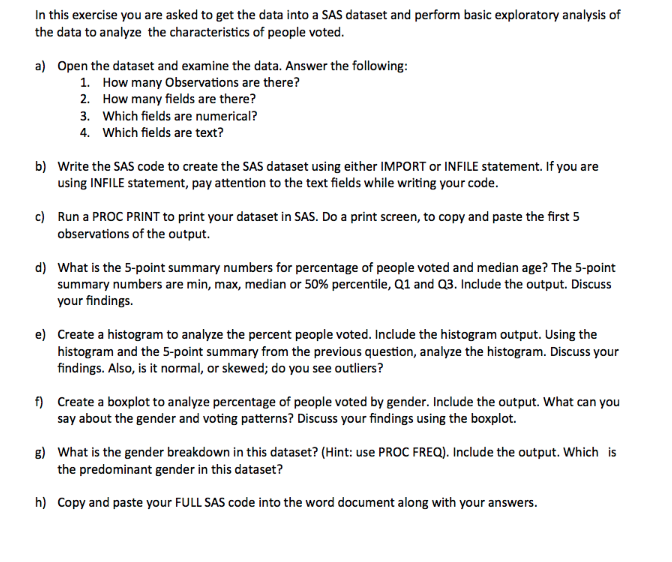
PROBLEM 2 [10 pts]-to be answered by everyone The file voting_1992.txt attached to this assignment provides data acquired from census records selected counties in the U.S. who voted in 1992 elections. The data show County Pct_Voted MedianAge MeanSavings Pct Poverty -Name of the county -Percentage of people voted -Median age of the voters in that county -Mean savings in U.S. Dollars in that county -Percentage of people living in poverty in that county PopulationDensity -Population density (Population divided by square miles) in that county Dominant gender of the people voted in that county In this exercise you are asked to get the data into a SAS dataset and perform basic exploratory analysis of the data to analyze the characteristics of people voted. a) Open the dataset and examine the data. Answer the following: 1. How many Observations are there? 2. How many fields are there? Which fields are numerical? Which fields are text? 3. 4. b) Write the SAS code to create the SAS dataset using either IMPORT or INFILE statement. If you are using INFILE statement, pay attention to the text fields while writing your code. c Run a PROC PRINT to print your dataset in SAS. Do a print screen, to copy and paste the first 5 observations of the output. What is the 5-point summary numbers for percentage of people voted and median age? The 5-point summary numbers are min, max, median or 50% percentile, Q1 and Q3. Include the output. Discuss your findings. d) e) Create a histogram to analyze the percent people voted. Include the histogram output. Using the histogram and the 5-point summary from the previous question, analyze the histogram. Discuss your findings. Also, is it normal, or skewed; do you see outliers? f Create a boxplot to analyze percentage of people voted by gender. Include the output. What can you say about the gender and voting patterns? Discuss your findings using the boxplot. g) What is the gender breakdown in this dataset? (Hint: use PROC FREQ)Include the output. Which is the predominant gender in this dataset? h) Copy and paste your FULL SAS code into the word document along with your answers. PROBLEM 2 [10 pts]-to be answered by everyone The file voting_1992.txt attached to this assignment provides data acquired from census records selected counties in the U.S. who voted in 1992 elections. The data show County Pct_Voted MedianAge MeanSavings Pct Poverty -Name of the county -Percentage of people voted -Median age of the voters in that county -Mean savings in U.S. Dollars in that county -Percentage of people living in poverty in that county PopulationDensity -Population density (Population divided by square miles) in that county Dominant gender of the people voted in that county In this exercise you are asked to get the data into a SAS dataset and perform basic exploratory analysis of the data to analyze the characteristics of people voted. a) Open the dataset and examine the data. Answer the following: 1. How many Observations are there? 2. How many fields are there? Which fields are numerical? Which fields are text? 3. 4. b) Write the SAS code to create the SAS dataset using either IMPORT or INFILE statement. If you are using INFILE statement, pay attention to the text fields while writing your code. c Run a PROC PRINT to print your dataset in SAS. Do a print screen, to copy and paste the first 5 observations of the output. What is the 5-point summary numbers for percentage of people voted and median age? The 5-point summary numbers are min, max, median or 50% percentile, Q1 and Q3. Include the output. Discuss your findings. d) e) Create a histogram to analyze the percent people voted. Include the histogram output. Using the histogram and the 5-point summary from the previous question, analyze the histogram. Discuss your findings. Also, is it normal, or skewed; do you see outliers? f Create a boxplot to analyze percentage of people voted by gender. Include the output. What can you say about the gender and voting patterns? Discuss your findings using the boxplot. g) What is the gender breakdown in this dataset? (Hint: use PROC FREQ)Include the output. Which is the predominant gender in this dataset? h) Copy and paste your FULL SAS code into the word document along with your answersStep by Step Solution
There are 3 Steps involved in it
Step: 1

Get Instant Access to Expert-Tailored Solutions
See step-by-step solutions with expert insights and AI powered tools for academic success
Step: 2

Step: 3

Ace Your Homework with AI
Get the answers you need in no time with our AI-driven, step-by-step assistance
Get Started


