Question
Say, you are a stockbroker, and a new client has approached you asking you about share prices. You take a random sample of share prices
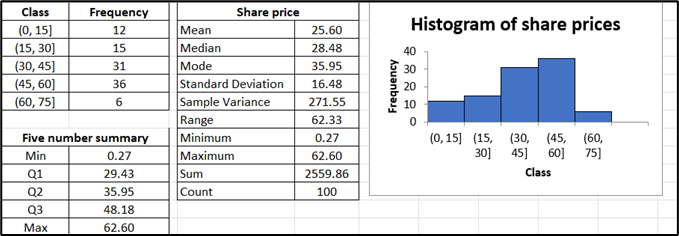
Say, you are a stockbroker, and a new client has approached you asking you about share prices. You take a random sample of share prices ($) and use EXCEL to create the following statistics:
Answer the following, in the context of this question.
a)State the "Who" and "What" of the analysis you are doing for the new client.
b)State the best measure of central tendency for your sample of data. Explain your reasoning and interpret your measurement to your new client.
c) State the best measure of spread for your sample of data. Explain your reasoning and interpret your measurement, for your new client
d)Find the relative cumulative frequency for the third class. Show your workings. Interpret your answer for your new client.
e)Describe a sampling method that you could have used to collect this data.

Step by Step Solution
There are 3 Steps involved in it
Step: 1

Get Instant Access to Expert-Tailored Solutions
See step-by-step solutions with expert insights and AI powered tools for academic success
Step: 2

Step: 3

Ace Your Homework with AI
Get the answers you need in no time with our AI-driven, step-by-step assistance
Get Started


