Scenario: You are a banker. The CFO of The Best Used Book Store is asking for a $100,000 loan. He explains that the company has successfully grown its inventory and has a current year return on equity of 15.1%. Sales grew 6% last year, and they are in need of additional working capital. Calculate the following financial ratios for the prior 3 years. (Go to Files for data.)
- Net profit margin
- Gross profit margin
- Operating expense as a percent of sales
- Return on assets
- Current ratio
- Quick ratio
- Return on equity
- Debt to equity
- Debt to assets
- Based on your analysis of the 3 years of information, describe the condition of the company. Is it healthy? Why or why not?
- What are your concerns about the company? Would you approve the loan? Why or why not?
Please make sure you submit this assignment. It should be submitted as a single Word document. Along with a narrative, you should include tables with the ratios shown.
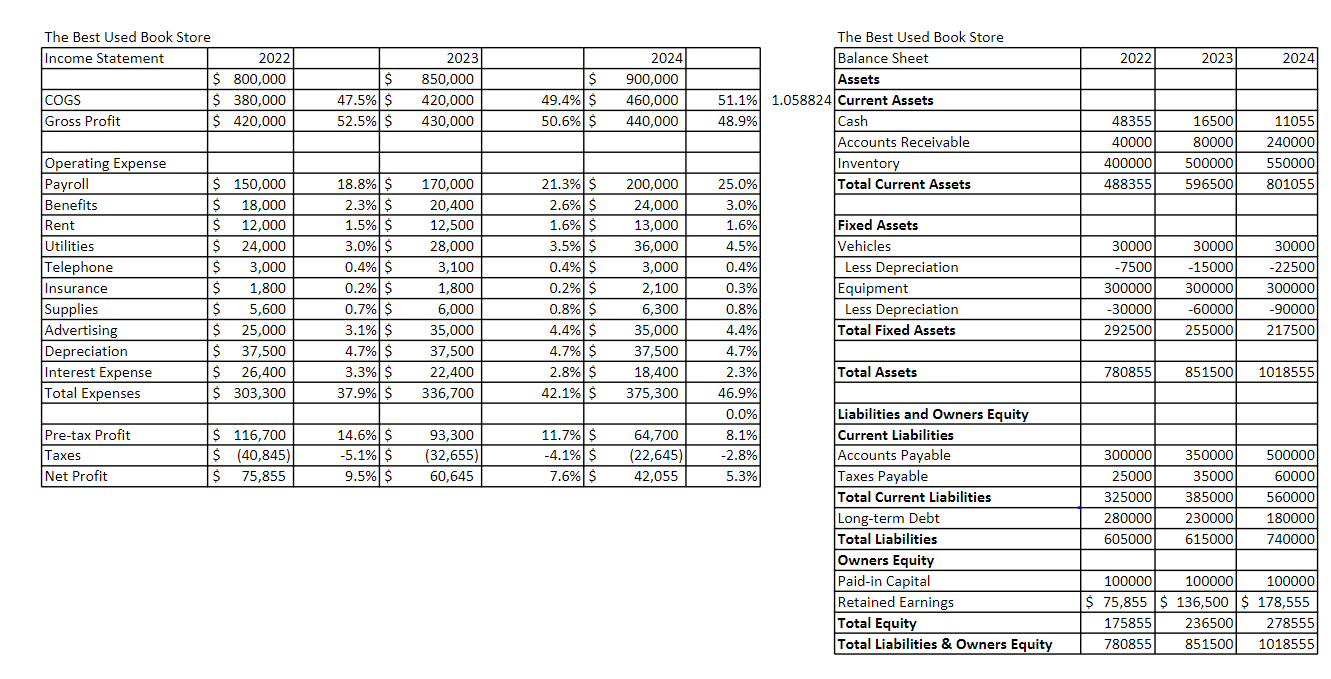
2022 2023 2024 The Best Used Book Store Income Statement 2022 $ 800,000 COGS $ 380,000 Gross Profit $ 420,000 $ 47.5% $ 52.5% $ 2023 850,000 420,000 430,000 S 49.4% S 50.6% $ 2024) 900,000 460,000 440,000 48355 40000 400000 488355) 16500 80000 500000 596500 11055 240000 550000 801055 Operating Expense Payroll Benefits Rent Utilities Telephone Insurance Supplies Advertising Depreciation Interest Expense Total Expenses $ 150,000 $ 18,000 $ 12,000 $ 24,000 $ 3,000 $ 1,800 $ 5,600 S 25,000 $ 37,500 S 26,400 $ 303,300 18.8% $ 2.3% $ 1.5% $ 3.0% $ 0.4% $ 0.2% $ 0.7% $ 3.1% $ 4.7% $ 3.3% $ 37.9% $ 170,000 20,400 12,500 28,000 3,100 1,800 6,000 35,000 37,500 22,400 336,700 21.3% $ 2.6% S 1.6% $ 3.5% S 0.4% $ 0.2% $ 0.8% S 4.4% s 4.7% $ 2.8% S 42.1%$ 200,000 24,000 13,000 36,000 3,000 2,100 6,300 35,000 37,500 18,400 375,300 30000 -7500 300000 -30000 292500 30000 - 15000 300000 -60000 255000 30000 -22500 300000 -90000 217500 The Best Used Book Store Balance Sheet Assets 51.1% 1.058824 Current Assets 48.9% Cash Accounts Receivable Inventory 25.0% Total Current Assets 3.0% 1.6% Fixed Assets 4.5% Vehicles 0.4% Less Depreciation 0.3% Equipment 0.8% Less Depreciation 4.4% Total Fixed Assets 4.7% 2.3% Total Assets 46.9% 0.0% Liabilities and Owners Equity 8.1% Current Liabilities -2.8% Accounts Payable 5.3% Taxes Payable Total Current Liabilities Long-term Debt Total Liabilities Owners Equity Paid-in Capital Retained Earnings Total Equity Total Liabilities & Owners Equity 780855 851500 1018555 Pre-tax Profit Taxes Net Profit $ 116,700 S (40,845) $ 75,855 14.6% $ -5.1%$ 9.5%$ 93,300 (32,655) 60,645 11.7%$ -4.1% $ 7.6% $ 64,700 (22,645) 42,055 300000 25000 325000 280000 605000 350000 35000 385000 230000 615000 500000 60000 560000 180000 740000 100000 100000 100000 $ 75,855 $ 136,500 $ 178,555 175855 236500 278555 780855 851500 1018555 2022 2023 2024 The Best Used Book Store Income Statement 2022 $ 800,000 COGS $ 380,000 Gross Profit $ 420,000 $ 47.5% $ 52.5% $ 2023 850,000 420,000 430,000 S 49.4% S 50.6% $ 2024) 900,000 460,000 440,000 48355 40000 400000 488355) 16500 80000 500000 596500 11055 240000 550000 801055 Operating Expense Payroll Benefits Rent Utilities Telephone Insurance Supplies Advertising Depreciation Interest Expense Total Expenses $ 150,000 $ 18,000 $ 12,000 $ 24,000 $ 3,000 $ 1,800 $ 5,600 S 25,000 $ 37,500 S 26,400 $ 303,300 18.8% $ 2.3% $ 1.5% $ 3.0% $ 0.4% $ 0.2% $ 0.7% $ 3.1% $ 4.7% $ 3.3% $ 37.9% $ 170,000 20,400 12,500 28,000 3,100 1,800 6,000 35,000 37,500 22,400 336,700 21.3% $ 2.6% S 1.6% $ 3.5% S 0.4% $ 0.2% $ 0.8% S 4.4% s 4.7% $ 2.8% S 42.1%$ 200,000 24,000 13,000 36,000 3,000 2,100 6,300 35,000 37,500 18,400 375,300 30000 -7500 300000 -30000 292500 30000 - 15000 300000 -60000 255000 30000 -22500 300000 -90000 217500 The Best Used Book Store Balance Sheet Assets 51.1% 1.058824 Current Assets 48.9% Cash Accounts Receivable Inventory 25.0% Total Current Assets 3.0% 1.6% Fixed Assets 4.5% Vehicles 0.4% Less Depreciation 0.3% Equipment 0.8% Less Depreciation 4.4% Total Fixed Assets 4.7% 2.3% Total Assets 46.9% 0.0% Liabilities and Owners Equity 8.1% Current Liabilities -2.8% Accounts Payable 5.3% Taxes Payable Total Current Liabilities Long-term Debt Total Liabilities Owners Equity Paid-in Capital Retained Earnings Total Equity Total Liabilities & Owners Equity 780855 851500 1018555 Pre-tax Profit Taxes Net Profit $ 116,700 S (40,845) $ 75,855 14.6% $ -5.1%$ 9.5%$ 93,300 (32,655) 60,645 11.7%$ -4.1% $ 7.6% $ 64,700 (22,645) 42,055 300000 25000 325000 280000 605000 350000 35000 385000 230000 615000 500000 60000 560000 180000 740000 100000 100000 100000 $ 75,855 $ 136,500 $ 178,555 175855 236500 278555 780855 851500 1018555