Answered step by step
Verified Expert Solution
Question
1 Approved Answer
Scientists commonly work with large data sets comprised of many individual data points. It is often necessary to present the center or middle of

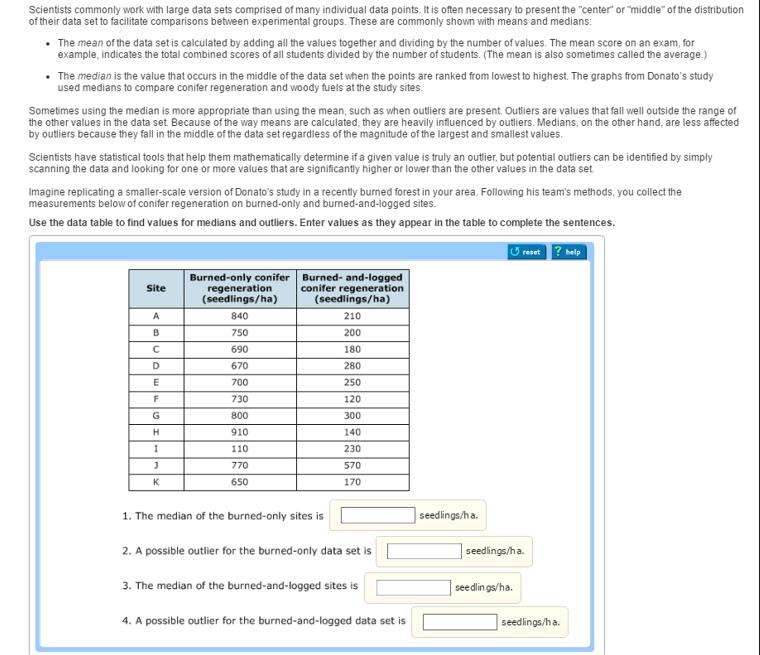
Scientists commonly work with large data sets comprised of many individual data points. It is often necessary to present the "center" or "middle" of the distribution of their data set to facilitate comparisons between experimental groups. These are commonly shown with means and medians: . The mean of the data set is calculated by adding all the values together and dividing by the number of values. The mean score on an exam, for example, indicates the total combined scores of all students divided by the number of students. (The mean is also sometimes called the average.) The median is the value that occurs in the middle of the data set when the points are ranked from lowest to highest. The graphs from Donato's study used medians to compare conifer regeneration and woody fuels at the study sites. Sometimes using the median is more appropriate than using the mean, such as when outliers are present. Outliers are values that fall well outside the range of the other values in the data set. Because of the way means are calculated, they are heavily influenced by outliers. Medians, on the other hand, are less affected by outliers because they fall in the middle of the data set regardless of the magnitude of the largest and smallest values. Scientists have statistical tools that help them mathematically determine if a given value is truly an outlier, but potential outliers can be identified by simply scanning the data and looking for one or more values that are significantly higher or lower than the other values in the data set Imagine replicating a smaller-scale version of Donato's study in a recently burned forest in your area. Following his team's methods, you collect the measurements below of conifer regeneration on burned-only and burned-and-logged sites. Use the data table to find values for medians and outliers. Enter values as they appear in the table to complete the sentences. Site A B C D E F G H I J K Burned-only conifer regeneration (seedlings/ha) 840 750 690 670 700 730 800 910 110 770 650 Burned-and-logged conifer regeneration (seedlings/ha) 210 1. The median of the burned-only sites is 200 180 280 250 120 300 140 230 570 170 2. A possible outlier for the burned-only data set is 3. The median of the burned-and-logged sites is 4. A possible outlier for the burned-and-logged data set is seedlings/ha. reset seedlings/ha. seedlings/ha. ? help seedlings/ha.
Step by Step Solution
★★★★★
3.48 Rating (158 Votes )
There are 3 Steps involved in it
Step: 1
01 First of all we need to sort the dataset This is our sorted dataset 110650670690700730750770800840910 11 elements We can find the median easily by ...
Get Instant Access to Expert-Tailored Solutions
See step-by-step solutions with expert insights and AI powered tools for academic success
Step: 2

Step: 3

Ace Your Homework with AI
Get the answers you need in no time with our AI-driven, step-by-step assistance
Get Started


