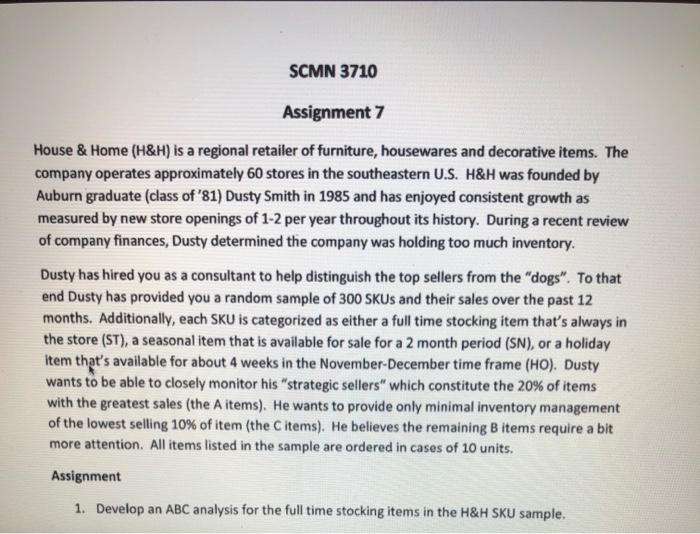
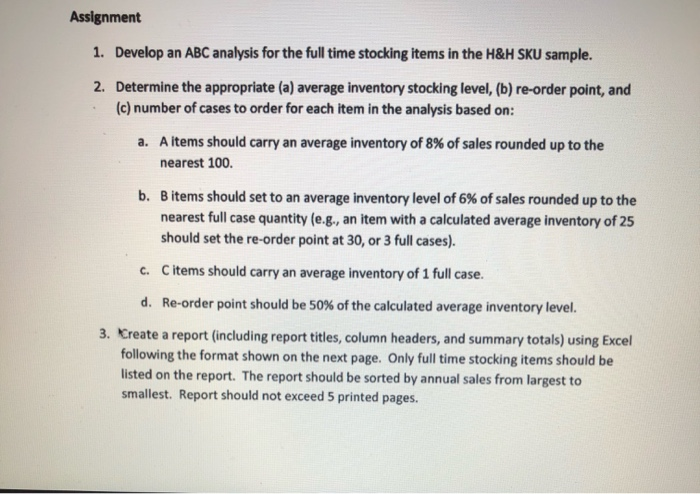
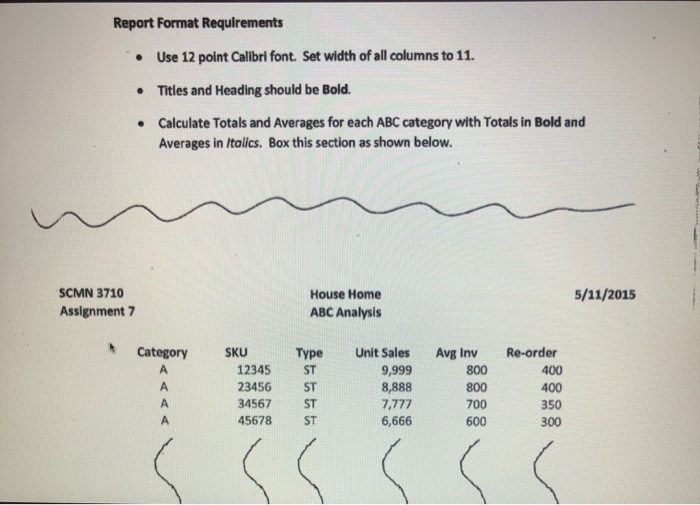
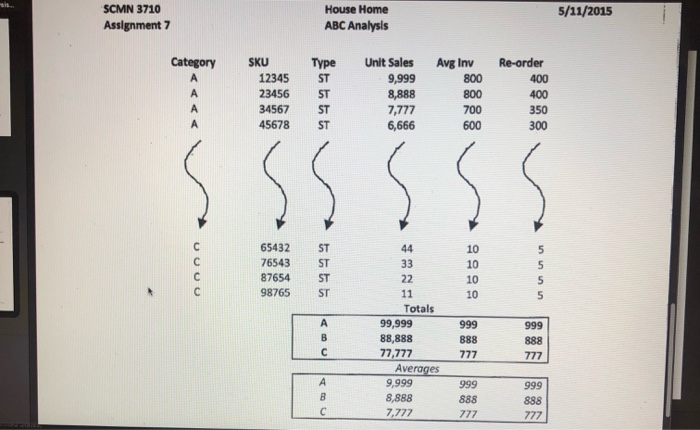
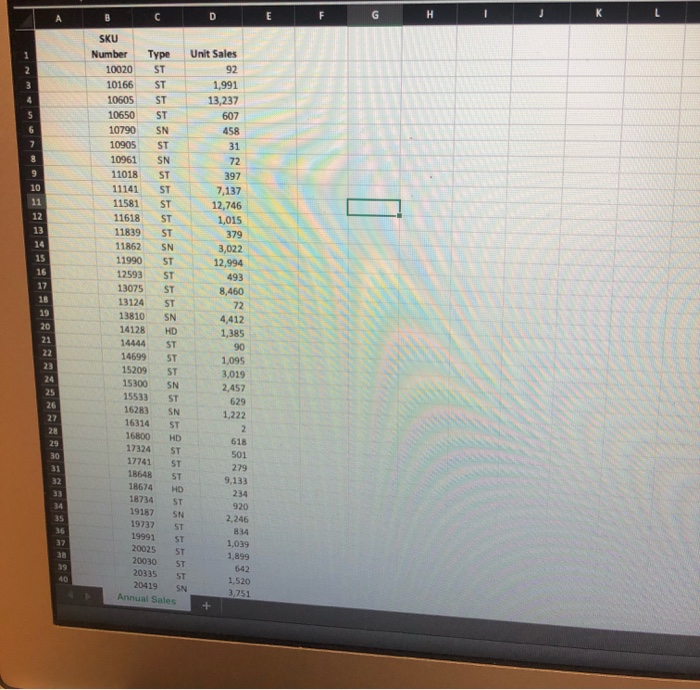
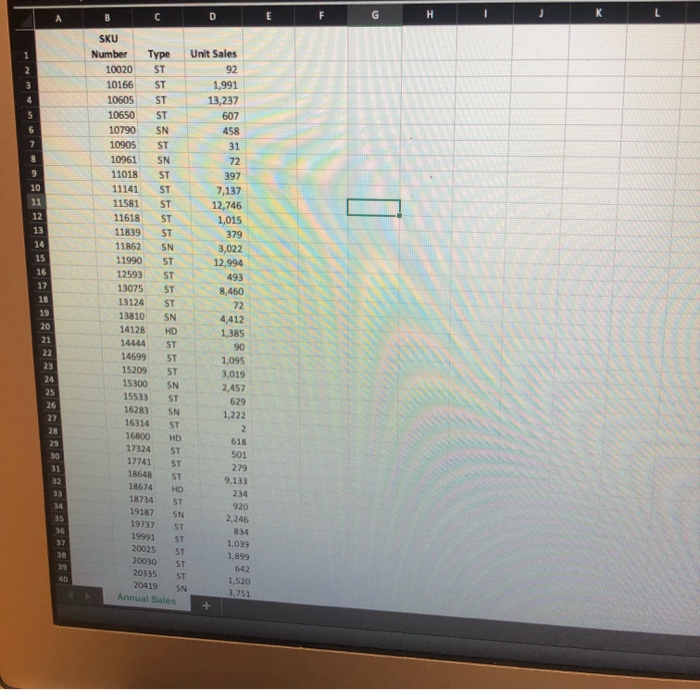
SCMN 3710 Assignment 7 House & Home (H&H) is a regional retailer of furniture, housewares and decorative items. The company operates approximately 60 stores in the southeastern U.S. H&H was founded by Auburn graduate (class of '81) Dusty Smith in 1985 and has enjoyed consistent growth as measured by new store openings of 1-2 per year throughout its history. During a recent review of company finances, Dusty determined the company was holding too much inventory. Dusty has hired you as a consultant to help distinguish the top sellers from the "dogs". To that end Dusty has provided you a random sample of 300 SKUS and their sales over the past 12 months. Additionally, each SKU is categorized as either a full time stocking item that's always in the store (ST), a seasonal item that is available for sale for a 2 month period (SN), or a holiday item that's available for about 4 weeks in the November-December time frame (HO). Dusty wants to be able to closely monitor his "strategic sellers" which constitute the 20% of items with the greatest sales (the A items). He wants to provide only minimal inventory management of the lowest selling 10% of item (the C items). He believes the remaining B items require a bit more attention. All items listed in the sample are ordered in cases of 10 units. Assignment Develop an ABC analysis for the full time stocking items in the H&H SKU sample. 1. Assignment Develop an ABC analysis for the full time stocking items in the H&H SKU sample. 1. 2. Determine the appropriate (a) average inventory stocking level, (b) re-order point, and (c) number of cases to order for each iterm in the analysis based on: A items should carry an average inventory of 8 % of sales rounded up to the nearest 100 a. b. B items should set to an average inventory level of 6 % of sales rounded up to the nearest full case quantity (e.g., an item with a calculated average inventory of 25 should set the re-order point at 30, or 3 full cases). Citems should carry an average inventory of 1 full case. C. Re-order point should be 50 % of the calculated average inventory level. d. 3. Create a report (including report titles, column headers, and summary totals) using Excel following the format shown on the next page. Only full time stocking items should be listed on the report. The report should be sorted by annual sales from largest to smallest. Report should not exceed 5 printed pages. 5/11/2015 sis SCMN 3710 House Home ABC Analysis Assignment 7 Category Unit Sales SKU Type Avg Inv Re-order A 12345 ST 9,999 800 400 A 23456 ST 8,888 7,777 6,666 800 400 A 34567 ST 700 350 A 45678 ST 600 300 65432 ST 44 10 5 76543 ST 33 10 5 87654 ST 22 10 98765 ST 11 10 Totals 99,999 88,888 77,777 Averages A 999 999 888 888 C 777 777 A 9,.999 999 999 8,888 888 888 C 7,777 777 777 n nnn UUUU K G E F C A SKU Unit Sales Number Type ST 92 10020 10166 ST 1,991 10605 ST 13,237 10650 ST 607 6 10790 SN 458 7 10905 ST 31 10961 SN 72 11018 ST 397 10 11141 ST 7,137 12,746 11 11581 ST 12 11618 ST 1,015 13 11839 ST 379 14 11862 SN 3,022 15 11990 ST 12,994 16 12593 ST 493 17 13075 ST 8,460 18 13124 ST 72 19 13810 SN 4,412 20 14128 HD 1,385 21 14444 ST 90 22 14699 ST 1,095 23 15209 ST 3,019 24 15300 SN 2,457 25 15533 ST 629 26 16283 SN 1,222 27 16314 ST 2 28 16800 17324 HD 618 29 ST 501 30 17741 ST 279 31 18648 ST 9,133 32 18674 HD 33 234 18734 ST 34 920 19187 19737 19991 20025 20030 SN 35 2,246 ST 36 834 ST 37 1,039 ST 38 1,899 ST 39 642 20335 ST 40 1,520 20419 SN 3.751 Annual Sales K G E F C A SKU Unit Sales Number Type ST 92 10020 10166 ST 1,991 10605 ST 13,237 10650 ST 607 6 10790 SN 458 7 10905 ST 31 10961 SN 72 11018 ST 397 10 11141 ST 7,137 12,746 11 11581 ST 12 11618 ST 1,015 13 11839 ST 379 14 11862 SN 3,022 15 11990 ST 12,994 16 12593 ST 493 17 13075 ST 8,460 18 13124 ST 72 19 13810 SN 4,412 20 14128 HD 1,385 21 14444 ST 90 22 14699 ST 1,095 23 15209 ST 3,019 24 15300 SN 2,457 25 15533 ST 629 26 16283 SN 1,222 27 16314 ST 2 28 16800 17324 HD 618 29 ST 501 30 17741 ST 279 31 18648 ST 9,133 32 18674 HD 33 234 18734 ST 34 920 19187 19737 19991 20025 20030 SN 35 2,246 ST 36 834 ST 37 1,039 ST 38 1,899 ST 39 642 20335 ST 40 1,520 20419 SN 3.751 Annual Sales SCMN 3710 Assignment 7 House & Home (H&H) is a regional retailer of furniture, housewares and decorative items. The company operates approximately 60 stores in the southeastern U.S. H&H was founded by Auburn graduate (class of '81) Dusty Smith in 1985 and has enjoyed consistent growth as measured by new store openings of 1-2 per year throughout its history. During a recent review of company finances, Dusty determined the company was holding too much inventory. Dusty has hired you as a consultant to help distinguish the top sellers from the "dogs". To that end Dusty has provided you a random sample of 300 SKUS and their sales over the past 12 months. Additionally, each SKU is categorized as either a full time stocking item that's always in the store (ST), a seasonal item that is available for sale for a 2 month period (SN), or a holiday item that's available for about 4 weeks in the November-December time frame (HO). Dusty wants to be able to closely monitor his "strategic sellers" which constitute the 20% of items with the greatest sales (the A items). He wants to provide only minimal inventory management of the lowest selling 10% of item (the C items). He believes the remaining B items require a bit more attention. All items listed in the sample are ordered in cases of 10 units. Assignment Develop an ABC analysis for the full time stocking items in the H&H SKU sample. 1. Assignment Develop an ABC analysis for the full time stocking items in the H&H SKU sample. 1. 2. Determine the appropriate (a) average inventory stocking level, (b) re-order point, and (c) number of cases to order for each iterm in the analysis based on: A items should carry an average inventory of 8 % of sales rounded up to the nearest 100 a. b. B items should set to an average inventory level of 6 % of sales rounded up to the nearest full case quantity (e.g., an item with a calculated average inventory of 25 should set the re-order point at 30, or 3 full cases). Citems should carry an average inventory of 1 full case. C. Re-order point should be 50 % of the calculated average inventory level. d. 3. Create a report (including report titles, column headers, and summary totals) using Excel following the format shown on the next page. Only full time stocking items should be listed on the report. The report should be sorted by annual sales from largest to smallest. Report should not exceed 5 printed pages. 5/11/2015 sis SCMN 3710 House Home ABC Analysis Assignment 7 Category Unit Sales SKU Type Avg Inv Re-order A 12345 ST 9,999 800 400 A 23456 ST 8,888 7,777 6,666 800 400 A 34567 ST 700 350 A 45678 ST 600 300 65432 ST 44 10 5 76543 ST 33 10 5 87654 ST 22 10 98765 ST 11 10 Totals 99,999 88,888 77,777 Averages A 999 999 888 888 C 777 777 A 9,.999 999 999 8,888 888 888 C 7,777 777 777 n nnn UUUU K G E F C A SKU Unit Sales Number Type ST 92 10020 10166 ST 1,991 10605 ST 13,237 10650 ST 607 6 10790 SN 458 7 10905 ST 31 10961 SN 72 11018 ST 397 10 11141 ST 7,137 12,746 11 11581 ST 12 11618 ST 1,015 13 11839 ST 379 14 11862 SN 3,022 15 11990 ST 12,994 16 12593 ST 493 17 13075 ST 8,460 18 13124 ST 72 19 13810 SN 4,412 20 14128 HD 1,385 21 14444 ST 90 22 14699 ST 1,095 23 15209 ST 3,019 24 15300 SN 2,457 25 15533 ST 629 26 16283 SN 1,222 27 16314 ST 2 28 16800 17324 HD 618 29 ST 501 30 17741 ST 279 31 18648 ST 9,133 32 18674 HD 33 234 18734 ST 34 920 19187 19737 19991 20025 20030 SN 35 2,246 ST 36 834 ST 37 1,039 ST 38 1,899 ST 39 642 20335 ST 40 1,520 20419 SN 3.751 Annual Sales K G E F C A SKU Unit Sales Number Type ST 92 10020 10166 ST 1,991 10605 ST 13,237 10650 ST 607 6 10790 SN 458 7 10905 ST 31 10961 SN 72 11018 ST 397 10 11141 ST 7,137 12,746 11 11581 ST 12 11618 ST 1,015 13 11839 ST 379 14 11862 SN 3,022 15 11990 ST 12,994 16 12593 ST 493 17 13075 ST 8,460 18 13124 ST 72 19 13810 SN 4,412 20 14128 HD 1,385 21 14444 ST 90 22 14699 ST 1,095 23 15209 ST 3,019 24 15300 SN 2,457 25 15533 ST 629 26 16283 SN 1,222 27 16314 ST 2 28 16800 17324 HD 618 29 ST 501 30 17741 ST 279 31 18648 ST 9,133 32 18674 HD 33 234 18734 ST 34 920 19187 19737 19991 20025 20030 SN 35 2,246 ST 36 834 ST 37 1,039 ST 38 1,899 ST 39 642 20335 ST 40 1,520 20419 SN 3.751 Annual Sales
