Answered step by step
Verified Expert Solution
Link Copied!

Question

1 Approved Answer

SECTION 2: COMPULSORY (weighting 70%) Company Information: The following financial statements relate to OBriens Limited, an SME that operates as a wholesale food manufacturer. The

SECTION 2: COMPULSORY (weighting 70%)
Company Information:
The following financial statements relate to OBriens Limited, an SME that operates as a wholesale food manufacturer. The company, which is located in Wales currently, employs 150 employees.
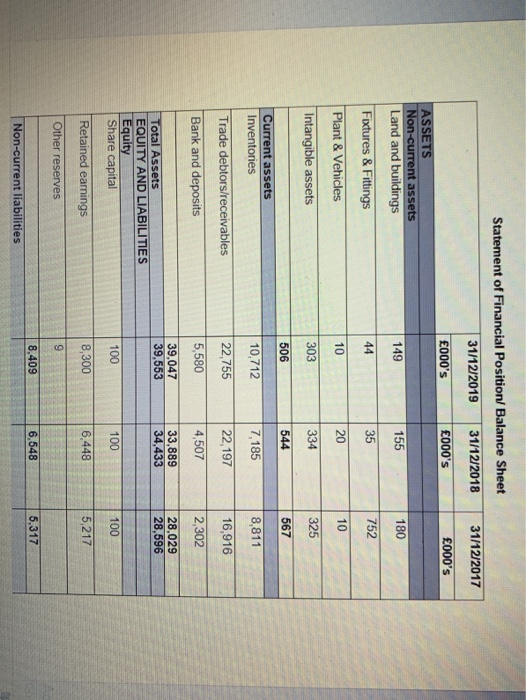
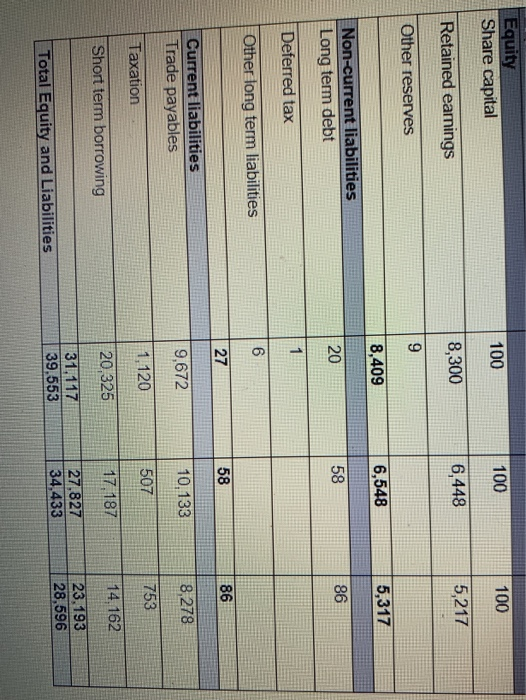
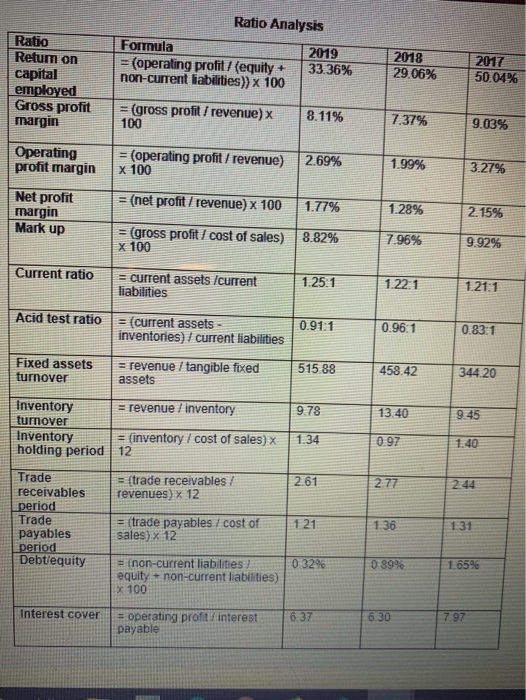
Using the following account statement from the images ( answer the following questions)
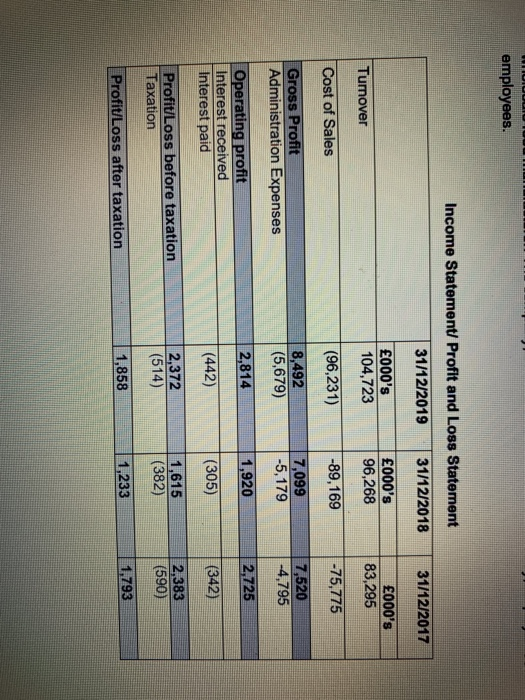
image text in transcribed
Basing your answers on the information contained within the financial accounts and ratio analysis for OBriens Ltd. answer all SEVEN questions below (Q4 - Q10). This section is worth 70% and all questions are equally weighted.
Q4. How has the business performed over the past three years in terms of generating sales and gross profit? (10 marks).
Q5. Explain what the return on capital employed ratio measures, why it is important and discuss how the business has performed in this regard over the period 2019-2016 (10 marks).
Q6. Explain the difference between operating profit margin and net profit margin and explain what they tell us about this business performance over the past three years? (10 marks).
Q7. Explain the difference between inventory turnover and inventory holding period and explain what the figures tell us about this business performance over the past three years (10 marks).
Q8. How has the business performed in terms of the time taken to pay suppliers and collect money from customers over the past three years? (10 marks).
Q9. Evaluate the liquidity of the business over the three years using the two relevant ratios and identify which is the more stringent measure and why (10 marks).
Q10. Evaluate the business gearing ratios over the three years using the two relevant ratios (10 marks).
employees. Income Statement Profit and Loss Statement 31/12/2019 31/12/2018 31/12/2017 000's 104,723 000's 96,268 000's 83,295 Turnover Cost of Sales (96,231) -89,169 -75,775 Gross Profit Administration Expenses 8,492 (5,679) 7,099 -5,179 7,520 -4,795 2,814 1,920 2,725 Operating profit Interest received Interest paid (442) (305) (342) | ProfitLoss before taxation Taxation 2,372 (514) 1,615 (382) 2,383 (590) Profit/Loss after taxation 1,858 1,233 1,793 Statement of Financial Position/ Balance Sheet 31/12/2019 31/12/2018 31/12/2017 000's 000's 000's ASSETS Non-current assets Land and buildings 149 180 Fixtures & Fittings 752 Plant & Vehicles Intangible assets 303 334 325 506 544 567 Current assets Inventories 10,712 7,185 8,811 Trade debtors/receivables 22,755 22,197 16,916 2,302 Bank and deposits 5,580 4,507 39,047 39,553 33,889 34,433 28,029 28,596 Total Assets EQUITY AND LIABILITIES Equity Share capital 100 100 100 Retained earnings 8,300 6,4485 ,217 Other reserves 8,409 6.548 5.317 Non-current liabilities Equity Share capital 100 100 100 8,300 6,448 5,217 Retained earnings Other reserves 8,409 6,548 5,317 Non-current liabilities Long term debt 20 58 Deferred tax Other long term liabilities 27 58 86 Current liabilities Trade payables 9,672 10,133 8,278 507 1,120 Taxation 753 17.187 20,325 Short term borrowing 14,162 31.117 39.553 27.827 34,433 23.193 28,596 Total Equity and Liabilities Ratio Analysis Formula 2019 = (operating profit / (equity + 33.36% non-current iabilities)) x 100 2018 29.06% Ratio Retum on capital employed Gross profit margin 2017 50.04% = (gross profit / revenue) 100 8.11% 7.37% 9.03% Operating profit margin = (operating profit/ revenue) x 100 2.69% 1.99% 3.27% = (net profit / revenue) x 100 1.77% 1.28% 2.15% Net profit margin Mark up = (gross profit / cost of sales) X 100 8.82% 7.96% 9.92% Current ratio current assets /current liabilities 1.25.1 | 1.22:1 | 1.21:1 Acid test ratio 0.91:1 0.96.1 (current assets inventories)/ current liabilities 0.83:1 515.88 | 458.42 344.20 Fixed assets turnover = revenue / tangible fixed assets 978 13.40 Inventory revenue / inventory turnover Inventory = (inventory / cost of sales) X holding period | 12 1.34 IN = (trade receivables / revenues) x 12 261 Trade receivables period Trade payables period Debtlequity = (trade payables / cost of sales) x 12 | 121 0.32% 0.39% 1.65% = (non-current liabilities/ equity - non-current liabilities) x 100 6.30 Interest cover 6.37 = operating profit interest payable

Step by Step Solution

There are 3 Steps involved in it

Step: 1

blur-text-image

Get Instant Access to Expert-Tailored Solutions

See step-by-step solutions with expert insights and AI powered tools for academic success

Step: 2

blur-text-image

Step: 3

blur-text-image

Ace Your Homework with AI

Get the answers you need in no time with our AI-driven, step-by-step assistance

Get Started

Recommended Textbook for

Construction Industry IRS Audit Techniques Guide

Authors: Internal Revenue Service

1st Edition

1304131920, 978-1304131928

More Books

Students also viewed these Accounting questions