Answered step by step
Verified Expert Solution
Question
1 Approved Answer
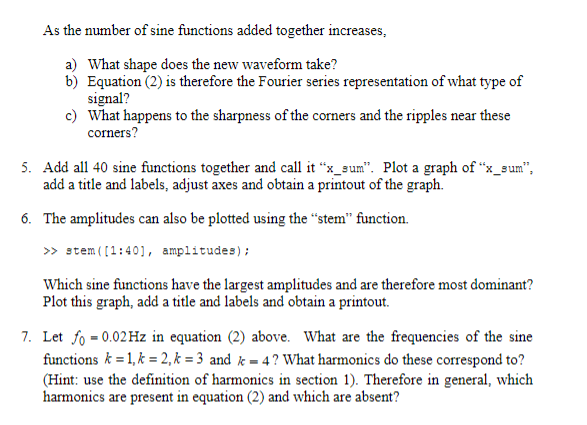
Section 3: Fourier Analysis Fourier analysis says that a real, odd, periodic signal can be represented as a sum of sine functions. Consider the following
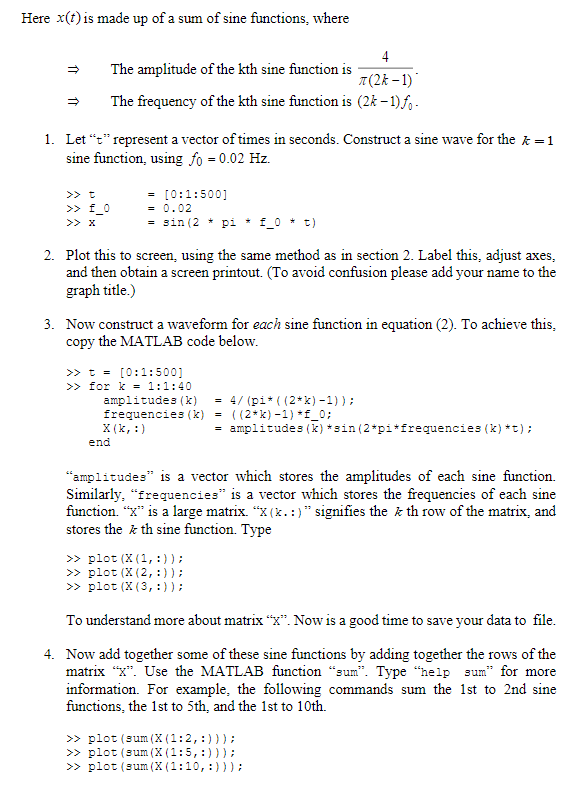
Section 3: Fourier Analysis Fourier analysis says that a real, odd, periodic signal can be represented as a sum of sine functions. Consider the following signal, where fo = 0.01 Hz. X(t) = 4 sin(27[2k - 1]fot) (2k-1) (2) As the number of sine functions added together increases, a) What shape does the new waveform take? b) Equation (2) is therefore the Fourier series representation of what type of signal? c) What happens to the sharpness of the corners and the ripples near these corners? 5. Add all 40 sine functions together and call it x_sum". Plot a graph of x_sum, add a title and labels, adjust axes and obtain a printout of the graph. 6. The amplitudes can also be plotted using the stem" function. >> stem([1:40), amplitudes); Which sine functions have the largest amplitudes and are therefore most dominant? Plot this graph, add a title and labels and obtain a printout. 7. Let fo = 0.02 Hz in equation (2) above. What are the frequencies of the sine functions k = 1, k = 2, k = 3 and k = 4? What harmonics do these correspond to? (Hint: use the definition of harmonics in section 1). Therefore in general, which harmonics are present in equation (2) and which are absent
Step by Step Solution
There are 3 Steps involved in it
Step: 1
Get Instant Access to Expert-Tailored Solutions
See step-by-step solutions with expert insights and AI powered tools for academic success
Step: 2
Step: 3
Ace Your Homework with AI
Get the answers you need in no time with our AI-driven, step-by-step assistance
Get Started