Answered step by step
Verified Expert Solution
Link Copied!

Question

1 Approved Answer

Section A - Answer any three (3) questions from this section Question 1 Consider the information in the following table which contains 20 daily observations
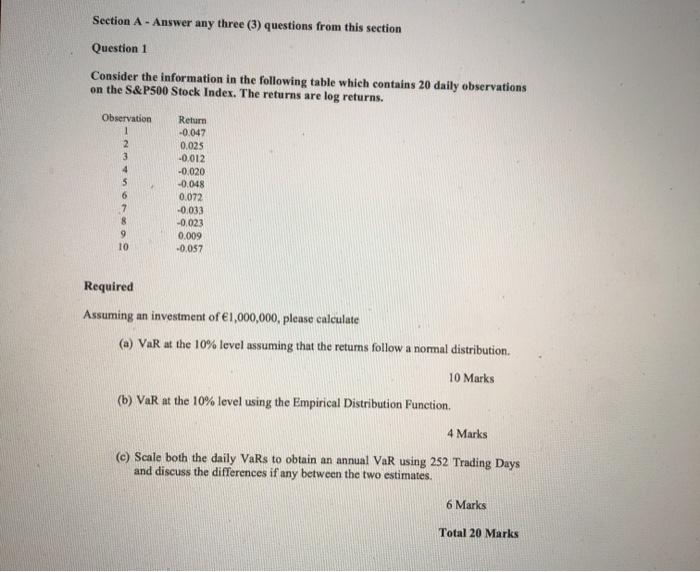
image text in transcribed
Section A - Answer any three (3) questions from this section Question 1 Consider the information in the following table which contains 20 daily observations on the S&P500 Stock Index. The returns are log returns. Observation 1 2 3 4 5 6 Return -0.047 0.025 -0.012 -0.020 -0.048 0.072 -0.033 -0.023 0.009 -0.057 8 10 Required Assuming an investment of 1,000,000, please calculate (a) VaR at the 10% level assuming that the returns follow a normal distribution 10 Marks (b) VaR at the 10% level using the Empirical Distribution Function, 4 Marks (C) Scale both the daily VaRs to obtain an annual VaR using 252 Trading Days and discuss the differences if any between the two estimates. 6 Marks Total 20 Marks

Step by Step Solution

There are 3 Steps involved in it

Step: 1

blur-text-image

Get Instant Access to Expert-Tailored Solutions

See step-by-step solutions with expert insights and AI powered tools for academic success

Step: 2

blur-text-image_2

Step: 3

blur-text-image_3

Ace Your Homework with AI

Get the answers you need in no time with our AI-driven, step-by-step assistance

Get Started

Recommended Textbook for

Liquidity Risk Management In Banks Economic And Regulatory Issues

Authors: Roberto Ruozi, Pierpaolo Ferrari

1st Edition

3642295800, 978-3642295805

More Books

Students also viewed these Finance questions