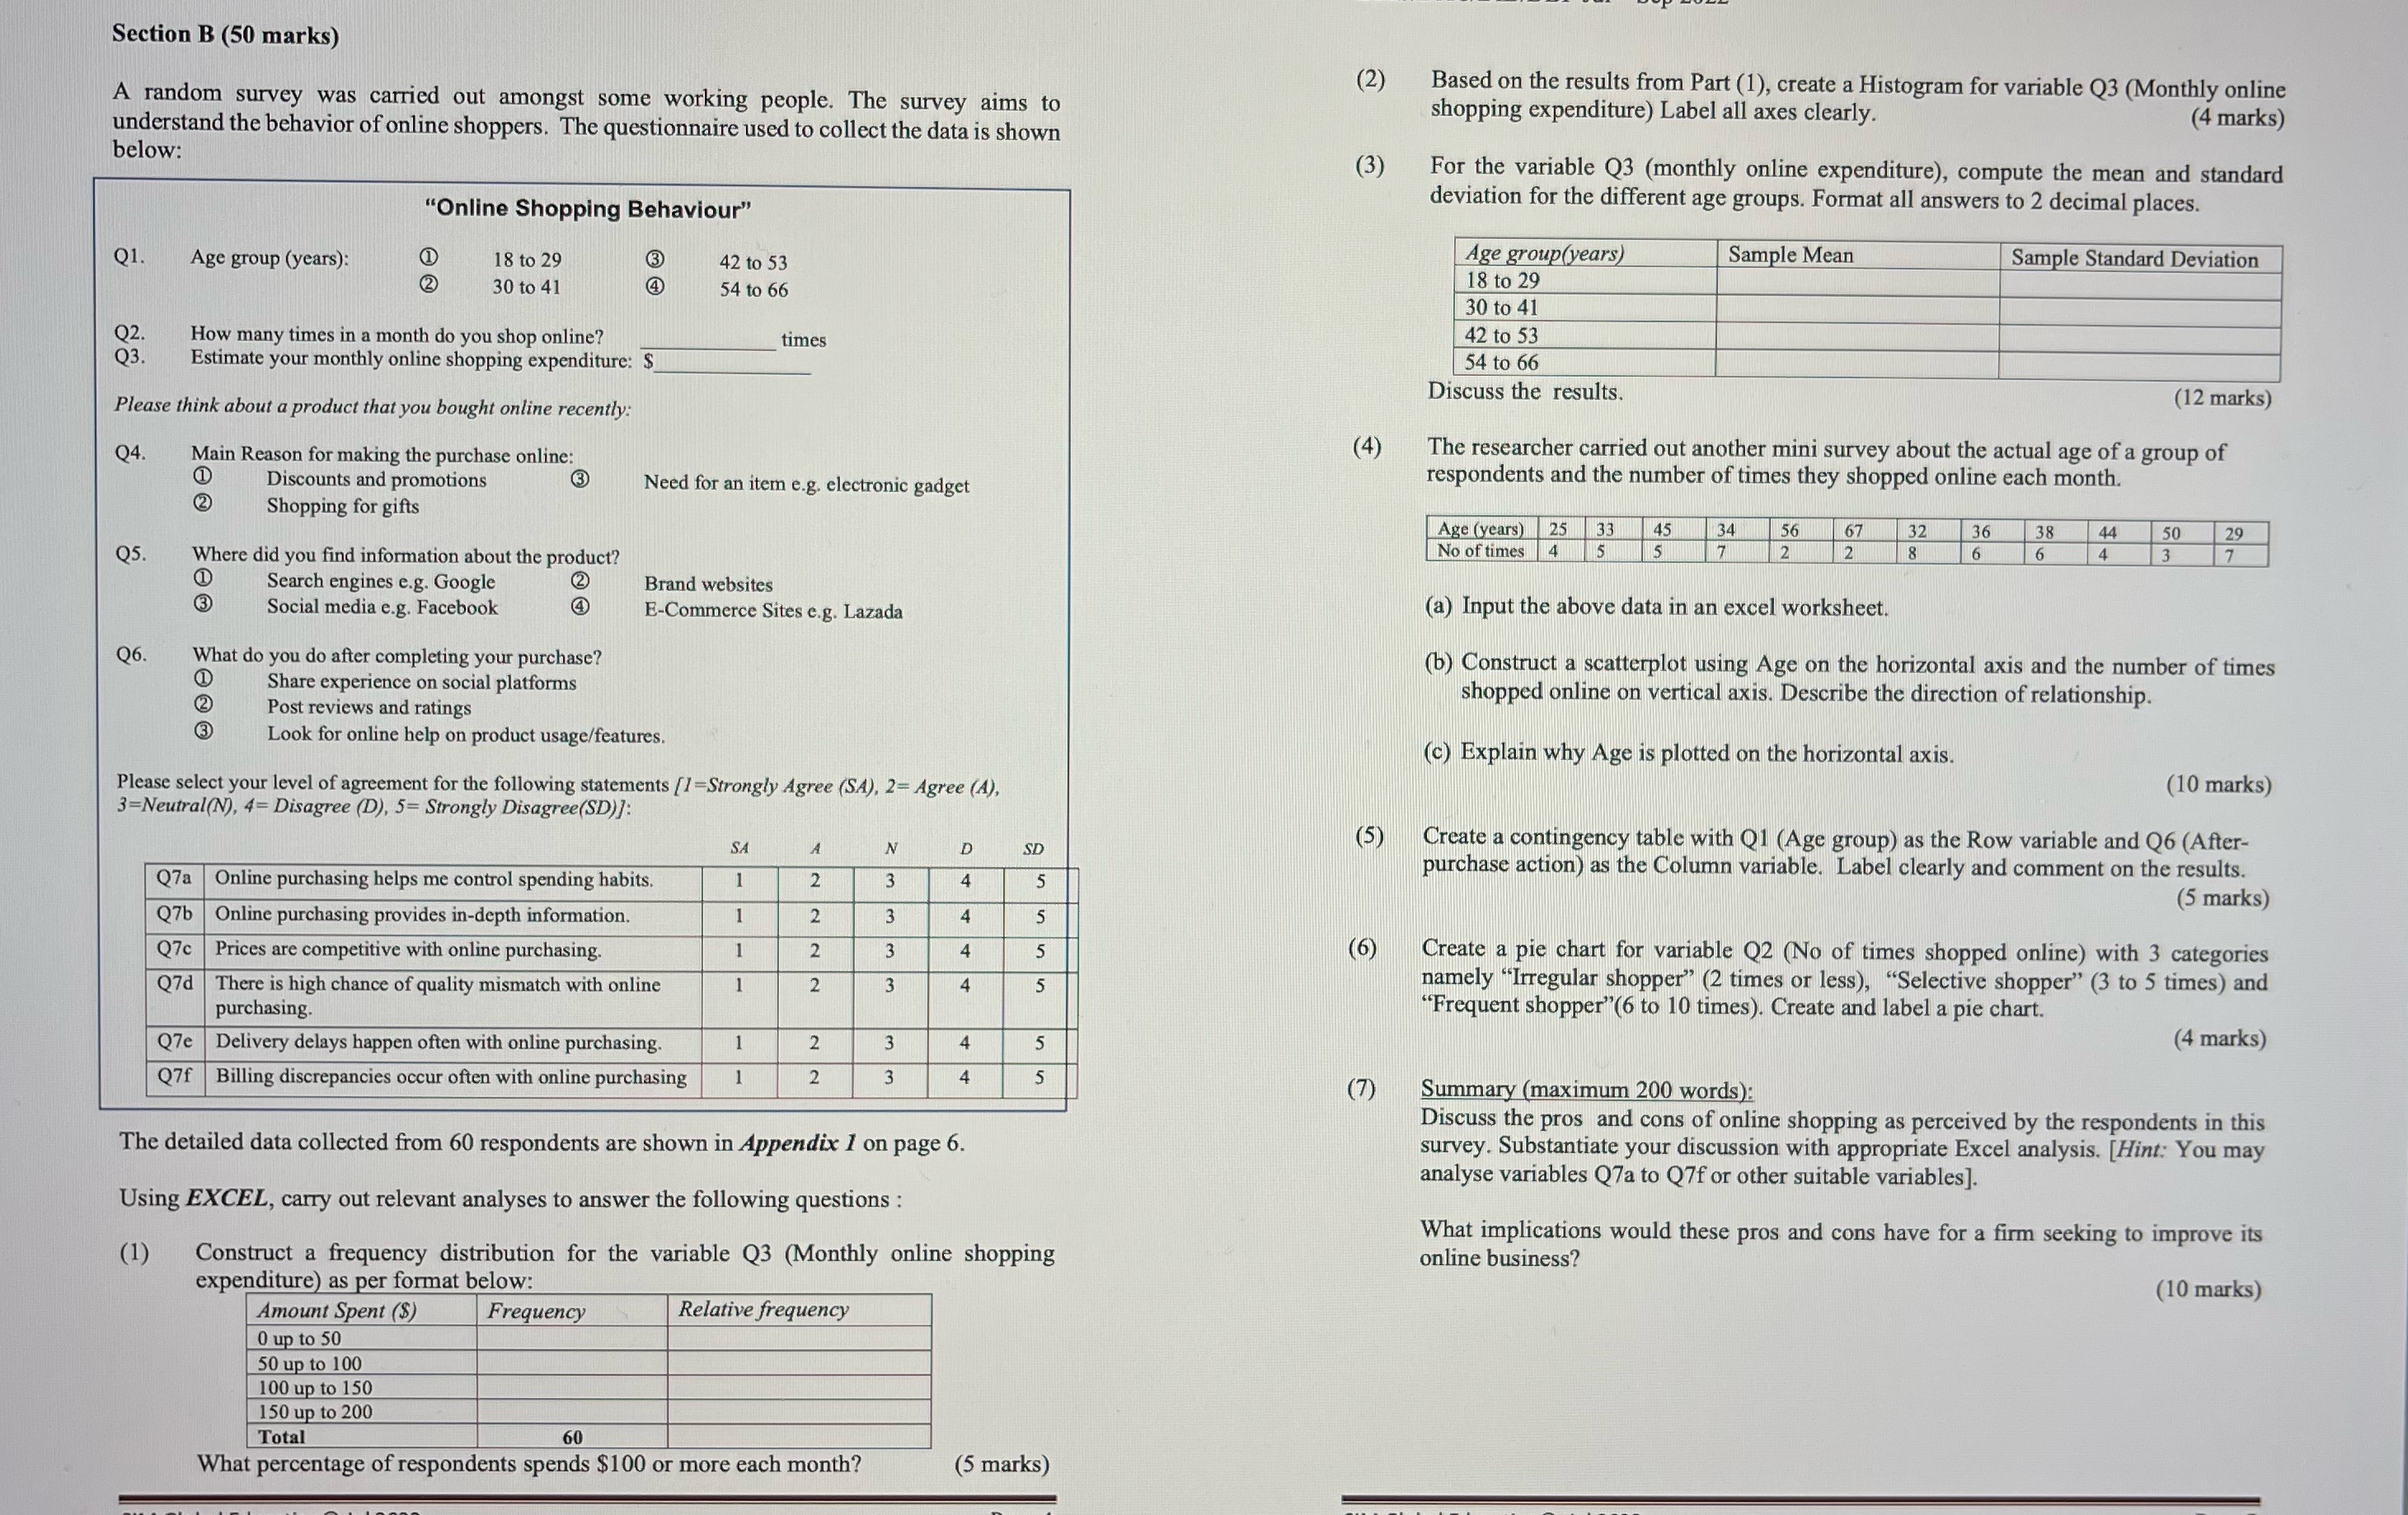
Section B (50 marks) (2) Based on the results from Part (1), create a Histogram for variable Q3 (Monthly online A random survey was carried out amongst some working people. The survey aims to shopping expenditure) Label all axes clearly. understand the behavior of online shoppers. The questionnaire used to collect the data is shown (4 marks) below: (3) For the variable Q3 (monthly online expenditure), compute the mean and standard "Online Shopping Behaviour" deviation for the different age groups. Format all answers to 2 decimal places. Q1. Age group (years): 18 to 29 (3 42 to 53 Age group(years) Sample Mean Sample Standard Deviation 30 to 41 4 54 to 66 18 to 29 30 to 41 Q2. How many times in a month do you shop online? times 42 to 53 03. Estimate your monthly online shopping expenditure: $ 54 to 66 Discuss the results. (12 marks) Please think about a product that you bought online recently: 04. Main Reason for making the purchase online: (4) The researcher carried out another mini survey about the actual age of a group of Discounts and promotions 3 Need for an item e.g. electronic gadget respondents and the number of times they shopped online each month. Shopping for gifts Age (years) 25 33 45 No of times 4 34 56 67 32 36 38 4 50 Where did you find information about the product? 6 6 4 3 7 D Search engines e.g. Google (2 Brand websites 3) Social media e.g. Facebook E-Commerce Sites e.g. Lazada (a) Input the above data in an excel worksheet. 06. What do you do after completing your purchase? (b) Construct a scatterplot using Age on the horizontal axis and the number of times Share experience on social platforms shopped online on vertical axis. Describe the direction of relationship. 2 Post reviews and ratings Look for online help on product usage/features (c) Explain why Age is plotted on the horizontal axis. Please select your level of agreement for the following statements [1=Strongly Agree (SA), 2- Agree (A), (10 marks) 3=Neutral(N), 4= Disagree (D), 5= Strongly Disagree(SD)]: SA (5) SD Create a contingency table with Q1 (Age group) as the Row variable and Q6 (After- purchase action) as the Column variable. Label clearly and comment on the results. Q7a Online purchasing helps me control spending habits. (5 marks) Q7b Online purchasing provides in-depth information. 27c Prices are competitive with online purchasing. (6) Create a pie chart for variable Q2 (No of times shopped online) with 3 categories Q7d There is high chance of quality mismatch with online 2 5 namely "Irregular shopper" (2 times or less), "Selective shopper" (3 to 5 times) and purchasing. "Frequent shopper"(6 to 10 times). Create and label a pie chart. Q7e Delivery delays happen often with online purchasing. (4 marks) Q7f Billing discrepancies occur often with online purchasing (7) Summary (maximum 200 words): Discuss the pros and cons of online shopping as perceived by the respondents in this The detailed data collected from 60 respondents are shown in Appendix 1 on page 6. survey. Substantiate your discussion with appropriate Excel analysis. [Hint: You may analyse variables Q7a to Q7f or other suitable variables]. Using EXCEL, carry out relevant analyses to answer the following questions : What implications would these pros and cons have for a firm seeking to improve its (1) Construct a frequency distribution for the variable Q3 (Monthly online shopping online business? expenditure) as per format below: (10 marks) Amount Spent ($) Frequency Relative frequency 0 up to 50 50 up to 100 100 up to 150 150 up to 200 Total 60 What percentage of respondents spends $100 or more each month


