select an option please
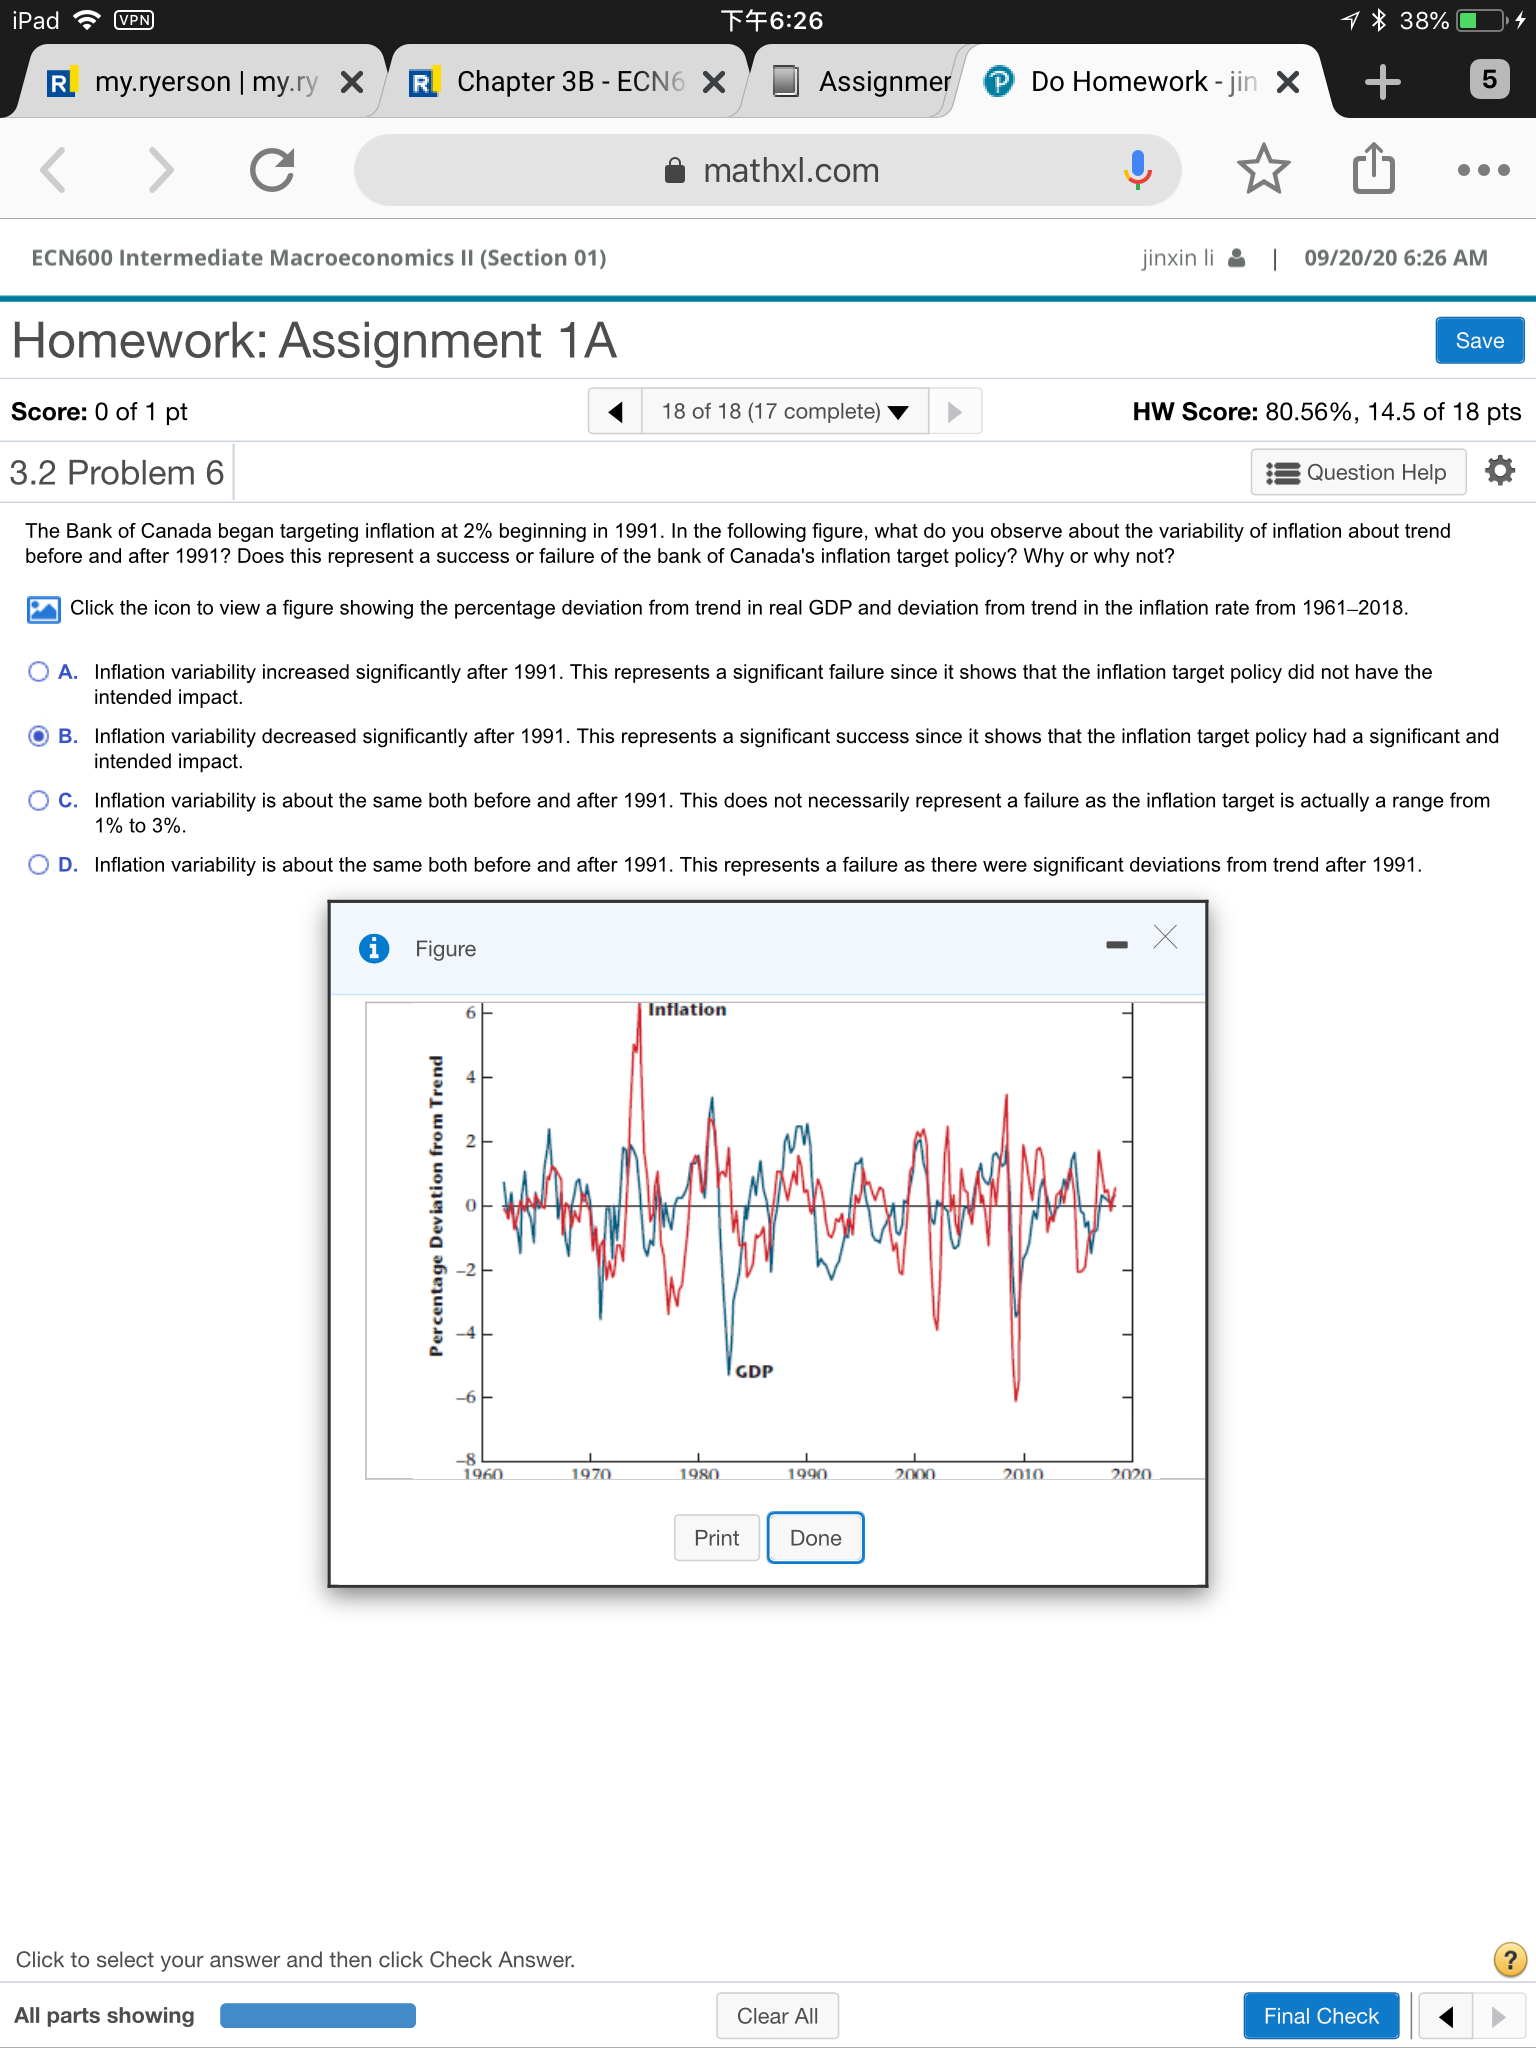
iPad VPN F +6:26 1 $ 38% RI my.ryerson | my.ry X RI Chapter 3B - ECN6 X Assignmer @ Do Homework - jin X 5 C mathxl.com . . . ECN600 Intermediate Macroeconomics II (Section 01) jinxin li & | 09/20/20 6:26 AM Homework: Assignment 1A Save Score: 0 of 1 pt 18 of 18 (17 complete) HW Score: 80.56%, 14.5 of 18 pts 3.2 Problem 6 Question Help The Bank of Canada began targeting inflation at 2% beginning in 1991. In the following figure, what do you observe about the variability of inflation about trend before and after 1991? Does this represent a success or failure of the bank of Canada's inflation target policy? Why or why not? Click the icon to view a figure showing the percentage deviation from trend in real GDP and deviation from trend in the inflation rate from 1961-2018. A. Inflation variability increased significantly after 1991. This represents a significant failure since it shows that the inflation target policy did not have the ntended impact. O B. Inflation variability decreased significantly after 1991. This represents a significant success since it shows that the inflation target policy had a significant and ntended impact. O C. Inflation variability is about the same both before and after 1991. This does not necessarily represent a failure as the inflation target is actually a range from % to 3%. O D. Inflation variability is about the same both before and after 1991. This represents a failure as there were significant deviations from trend after 1991. Click to select your answer and then click Check Answer. ? All parts showing Clear All Final CheckiPad VPN F +6:26 1 $ 38% RI my.ryerson | my.ry X RI Chapter 3B - ECN6 X Assignmer @ Do Homework - jin X 5 C mathxl.com . . . ECN600 Intermediate Macroeconomics II (Section 01) jinxin li & | 09/20/20 6:26 AM Homework: Assignment 1A Save Score: 0 of 1 pt 18 of 18 (17 complete) HW Score: 80.56%, 14.5 of 18 pts 3.2 Problem 6 Question Help The Bank of Canada began targeting inflation at 2% beginning in 1991. In the following figure, what do you observe about the variability of inflation about trend before and after 1991? Does this represent a success or failure of the bank of Canada's inflation target policy? Why or why not? Click the icon to view a figure showing the percentage deviation from trend in real GDP and deviation from trend in the inflation rate from 1961-2018. A. Inflation variability increased significantly after 1991. This represents a significant failure since it shows that the inflation target policy did not have the ntended impact. O B. Inflation variability decreased significantly after 1991. This represents a significant success since it shows that the inflation target policy had a significant and ntended impact. O C. Inflation variability is about the same both before and after 1991. This does not necessarily represent a failure as the inflation target is actually a range from % to 3%. O D. Inflation variability is about the same both before and after 1991. This represents a failure as there were significant deviations from trend after 1991. Figure X 6 Inflation Percentage Deviation from Trend GDP -6 SL 1960 1970 1980 1990 2000 2010 2020 Print Done Click to select your answer and then click Check Answer. ? All parts showing Clear All Final Check


