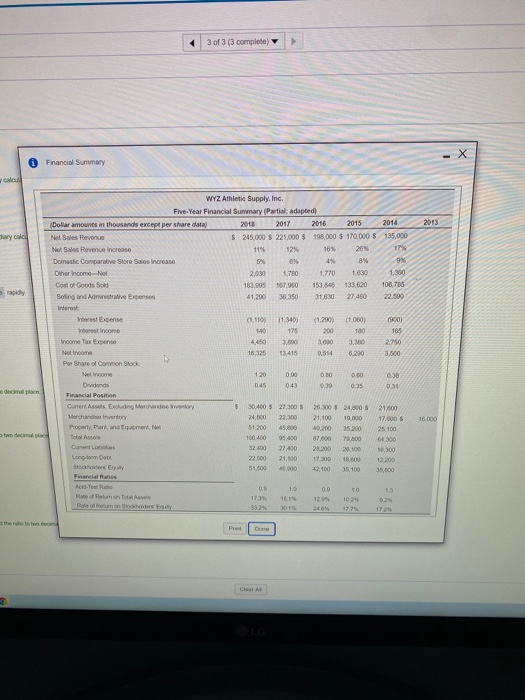
Select the formula reference in the last column of the table and compute the debt to equity ratio for each year. (Round the ratio to two decimal places, Xxx) (Click the icon to view the formulas.) 2018 2017 2016 2015 2014 Formula Debt to equity ratio Choose from any list or enter any number in the input fields and then click Check Answer 7 parts remaining Clear All Check Answer 3 of 3 (3 complete) Financial Summary 2013 WYZ Athletic Supply, Ing. Five-Year Financial Summary (Partial adapted) Dollar amowits in thousands excepe per share data 2018 2017 2016 2015 2014 Net Sales Revenue $ 245,000 $ 221.000 $ 199,000 $ 170.000 $ 135,000 Not Sales Revenue Increase 11% 12% 18% 26% 17% Domestic Compare Store Sales Increase 5% 0% 4% 8% Other inom Not 2,030 1,780 1.770 1.630 Cost of Goods Sold 163,805 167.000 150. 133 620 106.786 Soling and Ad v e Expenses 41.290 36.350 31.630 27.460 22.500 Expense (1110) (1 060) 180 11,340 175 30 13.415 (1,280) 200 3.090 9514 (900) 185 2.750 3.300 3.10 16325 0280 0.00 3 income Tax Expert Not income Per Share of common stock Net Income Dividends Financial Position Current Assets. Excluding Merchandise Merchandisinventory Property Pant and E mon Not 0.31 30.400 5 27300 5 24.000 22.500 51.200 45,800 100 400 5.00 32.400 27,50 22.500 21.00 51.500 .000 26300 $ 24,00 S 21,100 19000 46200 3200 07.000 9800 28200 20.000 17:30 18:00 2.00 35.100 21.600 17.000 $ 25.100 6300 300 12 200 Cuisis Longo Stockh Acid-Tout Rate 00 173 1000 16 1204 10 102 0 25 Select the formula reference in the last column of the table and compute the debt to equity ratio for each year. (Round the ratio to two decimal places, Xxx) (Click the icon to view the formulas.) 2018 2017 2016 2015 2014 Formula Debt to equity ratio Choose from any list or enter any number in the input fields and then click Check Answer 7 parts remaining Clear All Check Answer 3 of 3 (3 complete) Financial Summary 2013 WYZ Athletic Supply, Ing. Five-Year Financial Summary (Partial adapted) Dollar amowits in thousands excepe per share data 2018 2017 2016 2015 2014 Net Sales Revenue $ 245,000 $ 221.000 $ 199,000 $ 170.000 $ 135,000 Not Sales Revenue Increase 11% 12% 18% 26% 17% Domestic Compare Store Sales Increase 5% 0% 4% 8% Other inom Not 2,030 1,780 1.770 1.630 Cost of Goods Sold 163,805 167.000 150. 133 620 106.786 Soling and Ad v e Expenses 41.290 36.350 31.630 27.460 22.500 Expense (1110) (1 060) 180 11,340 175 30 13.415 (1,280) 200 3.090 9514 (900) 185 2.750 3.300 3.10 16325 0280 0.00 3 income Tax Expert Not income Per Share of common stock Net Income Dividends Financial Position Current Assets. Excluding Merchandise Merchandisinventory Property Pant and E mon Not 0.31 30.400 5 27300 5 24.000 22.500 51.200 45,800 100 400 5.00 32.400 27,50 22.500 21.00 51.500 .000 26300 $ 24,00 S 21,100 19000 46200 3200 07.000 9800 28200 20.000 17:30 18:00 2.00 35.100 21.600 17.000 $ 25.100 6300 300 12 200 Cuisis Longo Stockh Acid-Tout Rate 00 173 1000 16 1204 10 102 0 25