

Answered step by step
Verified Expert Solution
Question
1 Approved Answer
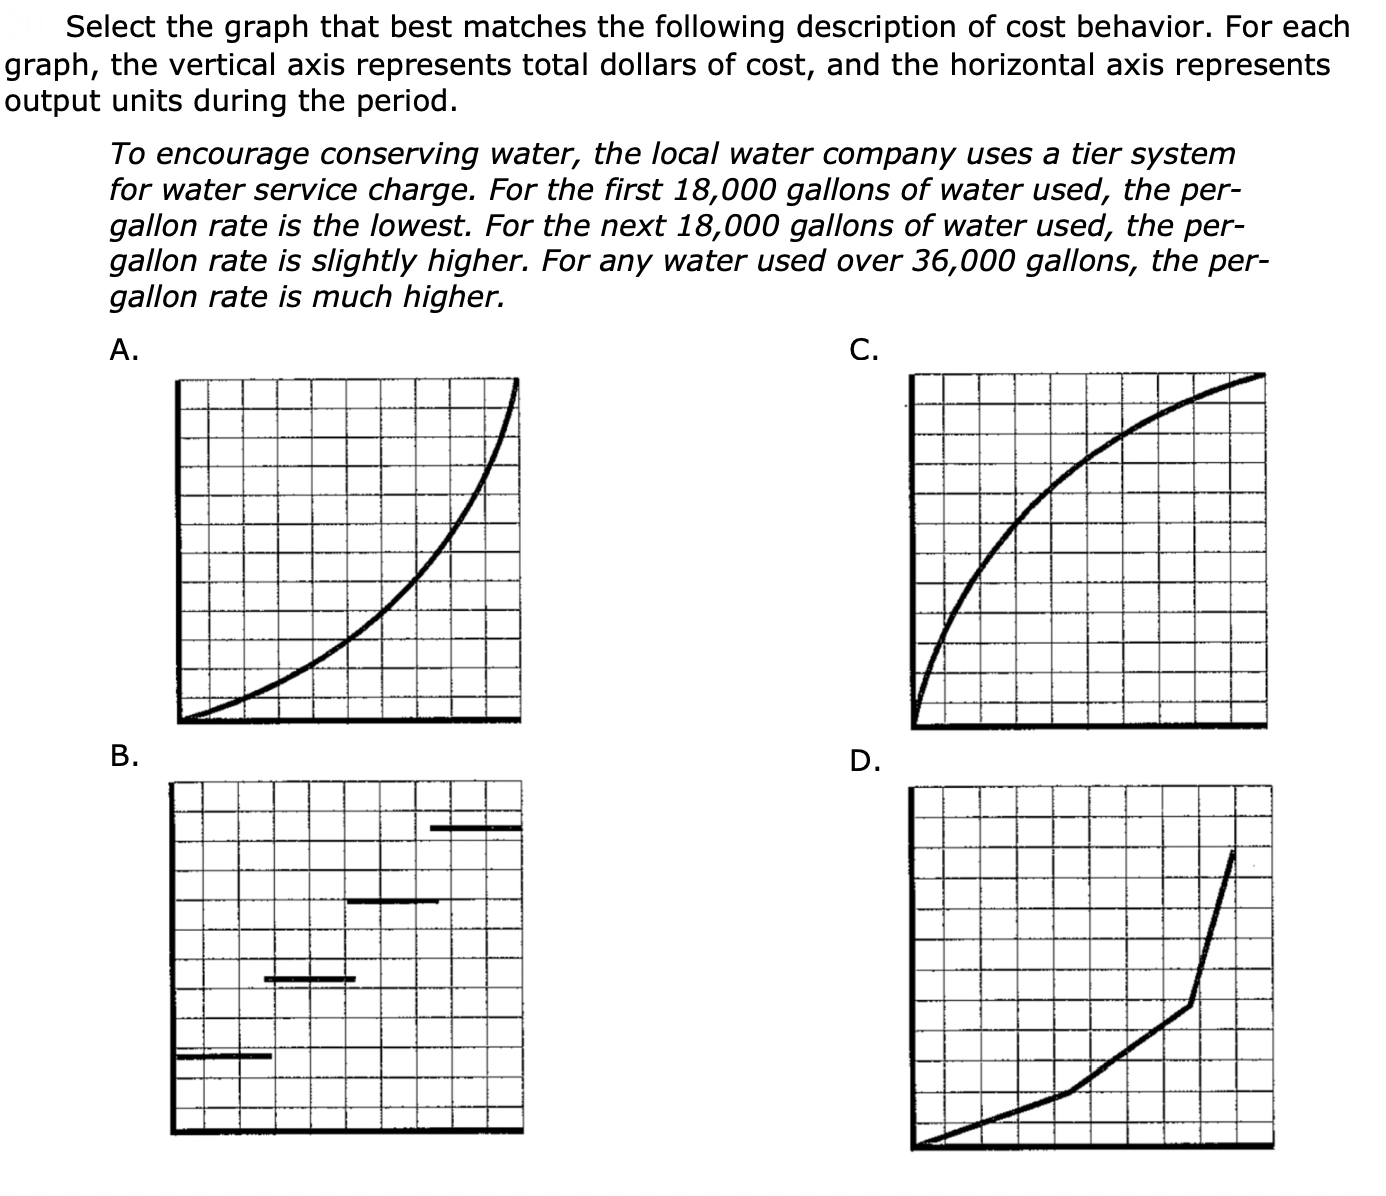
Select the graph that best matches the following description of cost behavior. For each graph, the vertical axis represents total dollars of cost, and the
Step by Step Solution
There are 3 Steps involved in it
Step: 1

Get Instant Access to Expert-Tailored Solutions
See step-by-step solutions with expert insights and AI powered tools for academic success
Step: 2

Step: 3
Ace Your Homework with AI
Get the answers you need in no time with our AI-driven, step-by-step assistance
Get Started
Survey of Accounting
Authors: Edmonds, old, Mcnair, Tsay
2nd edition
9780077392659, 978-0-07-73417, 77392655, 0-07-734177-5, 73379557, 978-0073379555