

Question
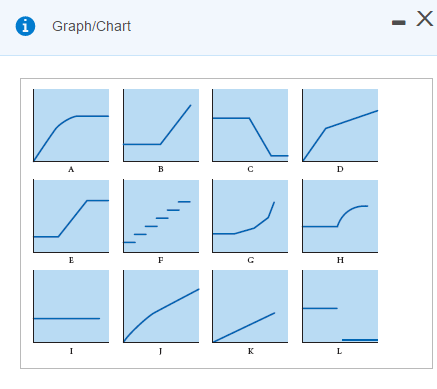
Select the graph that matches the numbered manufacturing cost data. Indicate by letter which graph best fits the situation or item described. 5. Annual depreciation
Select the graph that matches the numbered manufacturing cost data. Indicate by letter which graph best fits the situation or item described.
5.
Annual depreciation of equipment, where the amount is computed by the straight-line method. When the
depreciation schedule was prepared, it was anticipated that the obsolescence factor would be greater than
the wear-and-tear factor.
6.
Rent on a manufacturing plant donated by the city, where the agreement calls for a fixed-fee payment
unless 200,000 labor-hours are worked, in which case no rent is paid.
7.
Salaries of repair personnel, where one person is needed for every 1,000 machine-hours or less (that is, 0
to 1,000 hours requires one person, 1,001 to 2,000 hours requires two people, and so on.)
8.
Cost of direct materials used (assume no quantity discounts.)
9
Rent on a manufacturing plant donated by the county, where the agreement calls for rent of $100,000 to be
reduced by $1 for each direct manufacturing labor-hour worked in excess of 200,000 hours, but a minimum
rental fee of $20,000 must be paid.
Step by Step Solution
There are 3 Steps involved in it
Step: 1

Get Instant Access to Expert-Tailored Solutions
See step-by-step solutions with expert insights and AI powered tools for academic success
Step: 2

Step: 3
Ace Your Homework with AI
Get the answers you need in no time with our AI-driven, step-by-step assistance
Get Started
Financial Accounting Oakton Community College Tools For Business Decision Making
Authors: Paul D. Kimmel ,Jerry J. Weygandt ,Donald E. Kieso
6th Edition
1118113632, 978-1118113639