Answered step by step
Verified Expert Solution
Link Copied!

Question

1 Approved Answer

Selected financial data for Quick Sell, Inc., a retail store, appear as follows. Sales (all on account) Cost of goods sold Average inventory during the
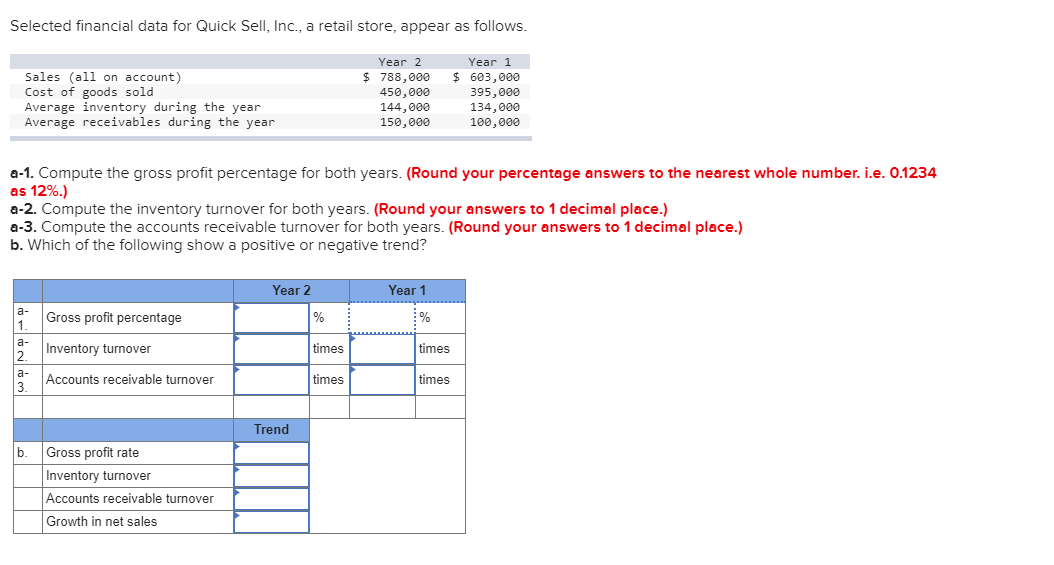
image text in transcribed

Selected financial data for Quick Sell, Inc., a retail store, appear as follows. Sales (all on account) Cost of goods sold Average inventory during the year Average receivables during the year Year 2 $ 788,000 450,000 144,000 150,000 Year 1 $ 603,000 395,000 134,000 100,000 a-1. Compute the gross profit percentage for both years. (Round your percentage answers to the nearest whole number. i.e. 0.1234 as 12%.) a-2. Compute the inventory turnover for both years. (Round your answers to 1 decimal place.) a-3. Compute the accounts receivable turnover for both years. (Round your answers to 1 decimal place.) b. Which of the following show a positive or negative trend? Year 1 Year 2 % a- Gross profit percentage times times Inventory turnover Accounts receivable turnover times times Trend Gross profit rate Inventory turnover Accounts receivable turnover Growth in net sales

Step by Step Solution

There are 3 Steps involved in it

Step: 1

blur-text-image

Get Instant Access to Expert-Tailored Solutions

See step-by-step solutions with expert insights and AI powered tools for academic success

Step: 2

blur-text-image

Step: 3

blur-text-image

Ace Your Homework with AI

Get the answers you need in no time with our AI-driven, step-by-step assistance

Get Started

Recommended Textbook for

Accounting for Non-Accounting Students

Authors: John R. Dyson

8th Edition

273722972, 978-0273722977

More Books

Students also viewed these Accounting questions