

Question: Set forth an Executive Dashboard and Project Status Report for Our Project (references, links, resources, materials included at the end . Use them ) Given:
Set forth an Executive Dashboard and Project Status Report for Our Project (references, links, resources, materials included at the end . Use them )
Given:
What is our project?
GO is a hypothetical software application that will help customers (travelers) navigate through an airport, assist them with airport directory information, and offer them different in-app features to make their airport experience immersive and engaging.
The software will be rolled out to customers in three milestones. Following are the features grouped by milestones
Milestones 1:
Navigation through the airport inclusive of:
- Airport Map integration for Tier 1 cities
- Support in English
- Real-time TSA waiting times
- Navigation between terminals
- Real-time schedule of trains
- Restrooms, restaurants, baggage claim locations
- App-based taxi service locations
Milestones 2:
- Partner with Restaurants
- Real-time food ordering via application
Milestone 3:
- Partner with airport services which includes ordering wheelchair, access, and buying passes for business / first class lounge
Required
As a project is in its execution phase, it's extremely important that our stakeholders be informed as to what is being achieved, any challenges that are arising or are predicted to have an impact, key performance indicators, and so much more! Knowledge is power and with key pieces of information presented at a frequency that makes sense for your project, people can be informed and take action quickly!
For this Project, we will assume we are 1 quarter, i.e. 3 months, into the execution of your project.
Two requirements
- Executive Dashboard- For the Executive Dashboard, you'll want to leverage KPIs that make sense for your project and are informative to your sponsor and other senior-level decision-makers. Some groups may have folks who have experience in dashboard software such as PowerBI and others may be more inexperienced in this area and would create a mock-up of a dashboard in a different tool such as MS Office, Figma, Piktochart etc. A great example of a dashboard is depicted in the image below:
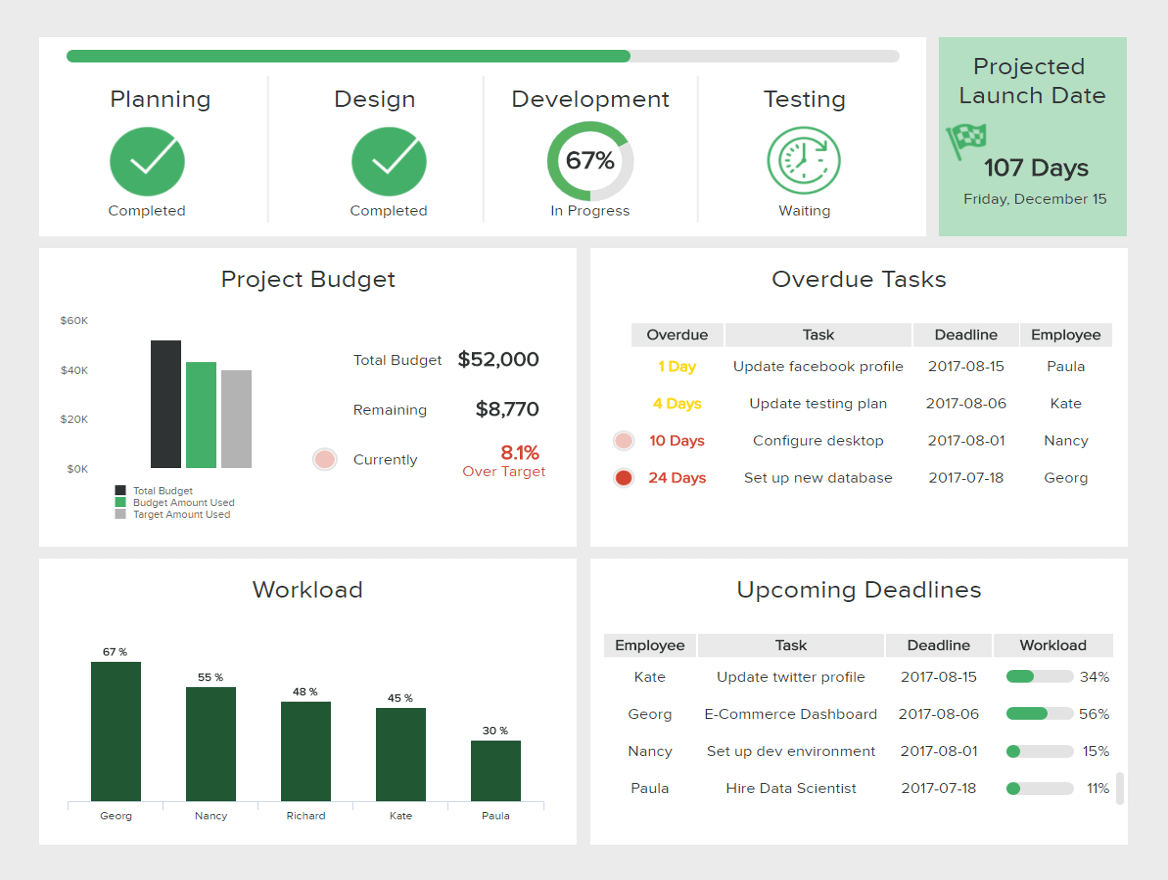
Projected Planning Design Development Testing Launch Date 67% 107 Days Friday, December 15 Completed Completed In Progress Waiting Project Budget Overdue Tasks $60K Overdue Task Deadline Employee Total Budget $52,000 1 Day Update facebook profile 2017-08-15 Paula $40K Remaining $8,770 4 Days Update testing plan 2017-08-06 Kate $20K 10 Days Configure desktop 2017-08-01 Nancy Currently 8.1% $OK Over Target 24 Days Set up new database 2017-07-18 Georg Total Budget Budget Amount Used Target Amount Used Workload Upcoming Deadlines Employee Task Deadline Workload 67 % 55 % Kate Update twitter profile 2017-08-15 34% 48 % 45% Georg E-Commerce Dashboard 2017-08-06 56% 30 % Nancy Set up dev environment 2017-08-01 15% Paula Hire Data Scientist 2017-07-18 11% Georg Nancy Richard Kate Paula
Step by Step Solution
There are 3 Steps involved in it

Get step-by-step solutions from verified subject matter experts