

Answered step by step
Verified Expert Solution
Question
1 Approved Answer
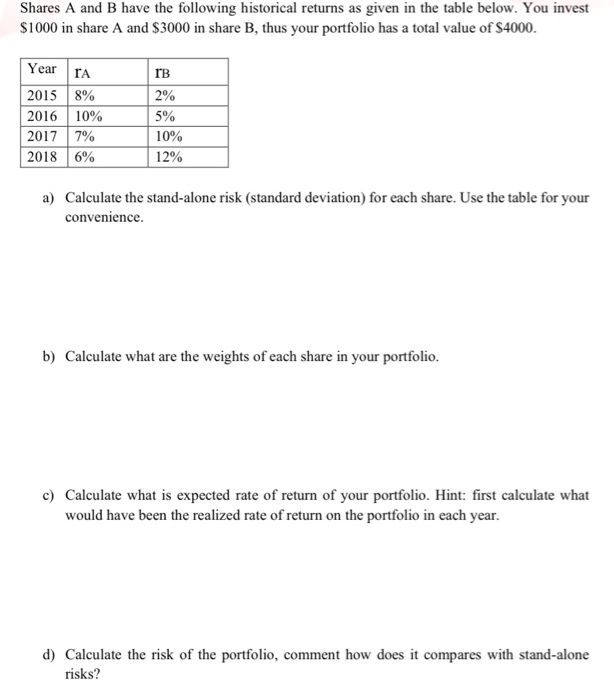
Shares A and B have the following historical returns as given in the table below. You invest $1000 in share A and $3000 in share
Step by Step Solution
There are 3 Steps involved in it
Step: 1

Get Instant Access to Expert-Tailored Solutions
See step-by-step solutions with expert insights and AI powered tools for academic success
Step: 2

Step: 3
Ace Your Homework with AI
Get the answers you need in no time with our AI-driven, step-by-step assistance
Get Started
The Pillars Of Finance The Misalignment Of Finance Theory And Investment Practice
Authors: G. Fraser-Sampson
2014th Edition
1137264055, 978-1137264053