Sheet 2
Name the second sheet of your workbook, NPV and IRR. The extra credit for Q1 also counts for Q2 here.
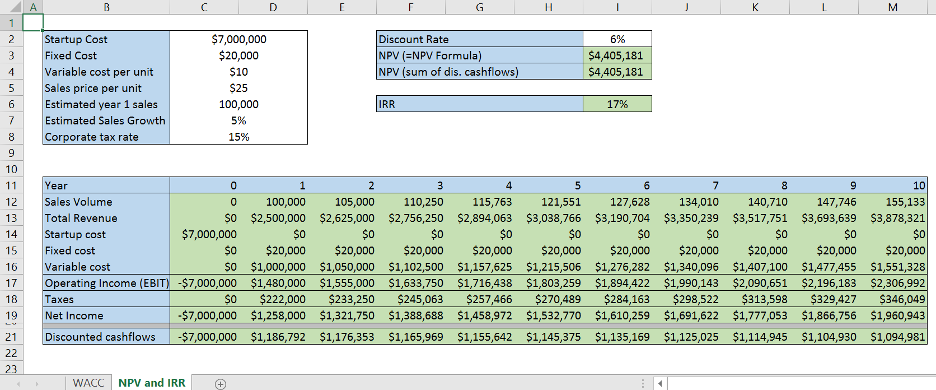
You will need to design a sheet to take as inputs the startup cost for a project, the fixed and variable costs, sales price, projected starting sales, projected sales growth, corporate tax rate and a discount rate. Using this you can calculate the operating income, net income and discounted cashflows.
Once you have the cashflows, you need to calculate the NPV. First calculate NPV using the =NPV formula in excel. Then sum your discounted cashflows. These two estimates of NPV should be the same. Be careful to make sure that the excel NPV formula starts from year 1.
Then use the IRR formula in excel to calculate the IRR for the project.
The following two questions can be answered in the excel document.
- What do we need to set the discount rate to, in order to get an NPV of zero?
- How low would year 1 sales have to be before we do not get a positive NPV at an 8% discount rate?

A B D G H M Discount Rate NPV (=NPV Formula) NPV (sum of dis. cashflows) 6% $4,405,181 $4,405,181 Startup Cost Fixed Cost Variable cost per unit Sales price per unit Estimated year 1 sales Estimated Sales Growth Corporate tax rate $7,000,000 $20,000 $10 $25 100,000 5% 15% IRR 17% ooc 1 2 3 4 5 6 7 8 9 10 11 12 13 14 15 16 17 18 19 Year 0 1 2 3 4 5 6 7 8 9 10 Sales Volume 0 100,000 105,000 110,250 115,763 121,551 127,628 134,010 140,710 147,746 155,133 Total Revenue $0 $2,500,000 $2,625,000 $2,756,250 $2,894,063 $3,038,766 $3,190,704 $3,350,239 $3,517,751 $3,693,639 $3,878,321 Startup cost $7,000,000 SO $0 $0 $0 SO SO $0 $0 $0 Fixed cost $o $20,000 $20,000 $20,000 $20,000 $20,000 $20,000 $20,000 $20,000 $20,000 $20,000 Variable cost $0 $1,000,000 $1,050,000 $1,102,500 $1,157,625 $1,215,506 $1,276,282 $1,340,096 $1,407,100 $1,477,455 $1,551,328 Operating Income (EBIT) -$7,000,000 $1,480,000 $1,555,000 $1,633,750 $1,716,438 $1,803,259 $1,894,422 $1,990,143 $2,090,651 $2,196,183 $2,306,992 Taxes SO $222,000 $233,250 $245,063 $257,466 $270,489 $284,163 $298,522 $313,598 $329,427 $346,049 Net Income $7,000,000 $1,258,000 $1,321,750 $1,388,688 $1,458,972 $1,532,770 $1,610,259 $1,691,622 $1,777,053 $1,866,756 $1,960,943 Discounted cashflows -$7,000,000 $1,186,792 $1,176,353 $1,165,969 $1,155,642 $1,145,375 $1,135,169 $1,125,025 $1,114,945 $1,104,930 $1,094,981 21 22 23 WACC NPV and IRR # : A B D G H M Discount Rate NPV (=NPV Formula) NPV (sum of dis. cashflows) 6% $4,405,181 $4,405,181 Startup Cost Fixed Cost Variable cost per unit Sales price per unit Estimated year 1 sales Estimated Sales Growth Corporate tax rate $7,000,000 $20,000 $10 $25 100,000 5% 15% IRR 17% ooc 1 2 3 4 5 6 7 8 9 10 11 12 13 14 15 16 17 18 19 Year 0 1 2 3 4 5 6 7 8 9 10 Sales Volume 0 100,000 105,000 110,250 115,763 121,551 127,628 134,010 140,710 147,746 155,133 Total Revenue $0 $2,500,000 $2,625,000 $2,756,250 $2,894,063 $3,038,766 $3,190,704 $3,350,239 $3,517,751 $3,693,639 $3,878,321 Startup cost $7,000,000 SO $0 $0 $0 SO SO $0 $0 $0 Fixed cost $o $20,000 $20,000 $20,000 $20,000 $20,000 $20,000 $20,000 $20,000 $20,000 $20,000 Variable cost $0 $1,000,000 $1,050,000 $1,102,500 $1,157,625 $1,215,506 $1,276,282 $1,340,096 $1,407,100 $1,477,455 $1,551,328 Operating Income (EBIT) -$7,000,000 $1,480,000 $1,555,000 $1,633,750 $1,716,438 $1,803,259 $1,894,422 $1,990,143 $2,090,651 $2,196,183 $2,306,992 Taxes SO $222,000 $233,250 $245,063 $257,466 $270,489 $284,163 $298,522 $313,598 $329,427 $346,049 Net Income $7,000,000 $1,258,000 $1,321,750 $1,388,688 $1,458,972 $1,532,770 $1,610,259 $1,691,622 $1,777,053 $1,866,756 $1,960,943 Discounted cashflows -$7,000,000 $1,186,792 $1,176,353 $1,165,969 $1,155,642 $1,145,375 $1,135,169 $1,125,025 $1,114,945 $1,104,930 $1,094,981 21 22 23 WACC NPV and IRR #


