

Answered step by step
Verified Expert Solution
Question
1 Approved Answer
Show all work and matlab code with results thanks For the system shown in the figure below, the input is the displacement y(t) and the
Show all work and matlab code with results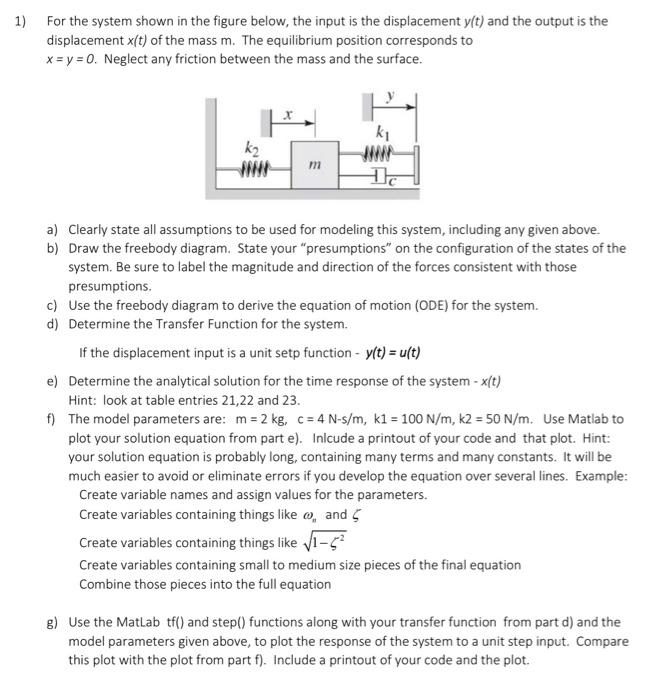
For the system shown in the figure below, the input is the displacement y(t) and the output is the displacement x(t) of the mass m. The equilibrium position corresponds to x=y=0. Neglect any friction between the mass and the surface. a) Clearly state all assumptions to be used for modeling this system, including any given above. b) Draw the freebody diagram. State your "presumptions" on the configuration of the states of the system. Be sure to label the magnitude and direction of the forces consistent with those presumptions. c) Use the freebody diagram to derive the equation of motion (ODE) for the system. d) Determine the Transfer Function for the system. If the displacement input is a unit setp function y(t)=u(t) e) Determine the analytical solution for the time response of the system x(t) Hint: look at table entries 21,22 and 23. f) The model parameters are: m=2kg,c=4Ns/m,k1=100N/m,k2=50N/m. Use Matlab to plot your solution equation from part e). Inlcude a printout of your code and that plot. Hint: your solution equation is probably long, containing many terms and many constants. It will be much easier to avoid or eliminate errors if you develop the equation over several lines. Example: Create variable names and assign values for the parameters. Create variables containing things like n and Create variables containing things like 12 Create variables containing small to medium size pieces of the final equation Combine those pieces into the full equation g) Use the MatLab tf() and step() functions aiong with your transfer function from part d) and the model parameters given above, to plot the response of the system to a unit step input. Compare this plot with the plot from part f). Include a printout of your code and the plot thanks
Step by Step Solution
There are 3 Steps involved in it
Step: 1

Get Instant Access to Expert-Tailored Solutions
See step-by-step solutions with expert insights and AI powered tools for academic success
Step: 2

Step: 3
Ace Your Homework with AI
Get the answers you need in no time with our AI-driven, step-by-step assistance
Get Started
Structured Search For Big Data From Keywords To Key-objects
Authors: Mikhail Gilula
1st Edition
012804652X, 9780128046524