Show All Your Work! Refer to the balance sheet and income statement for Sempra Energy (SRE), the parent company of SDG&E. Please calculate the following financial ratios for the fiscal year that ended December 31, 2019:
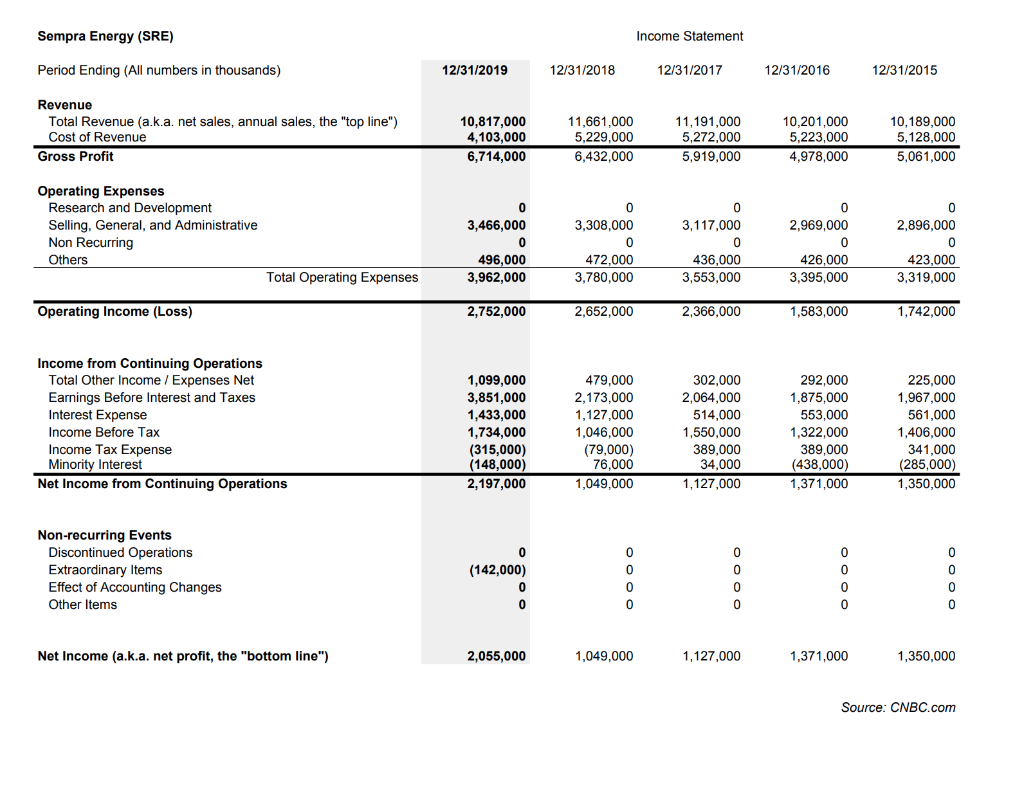
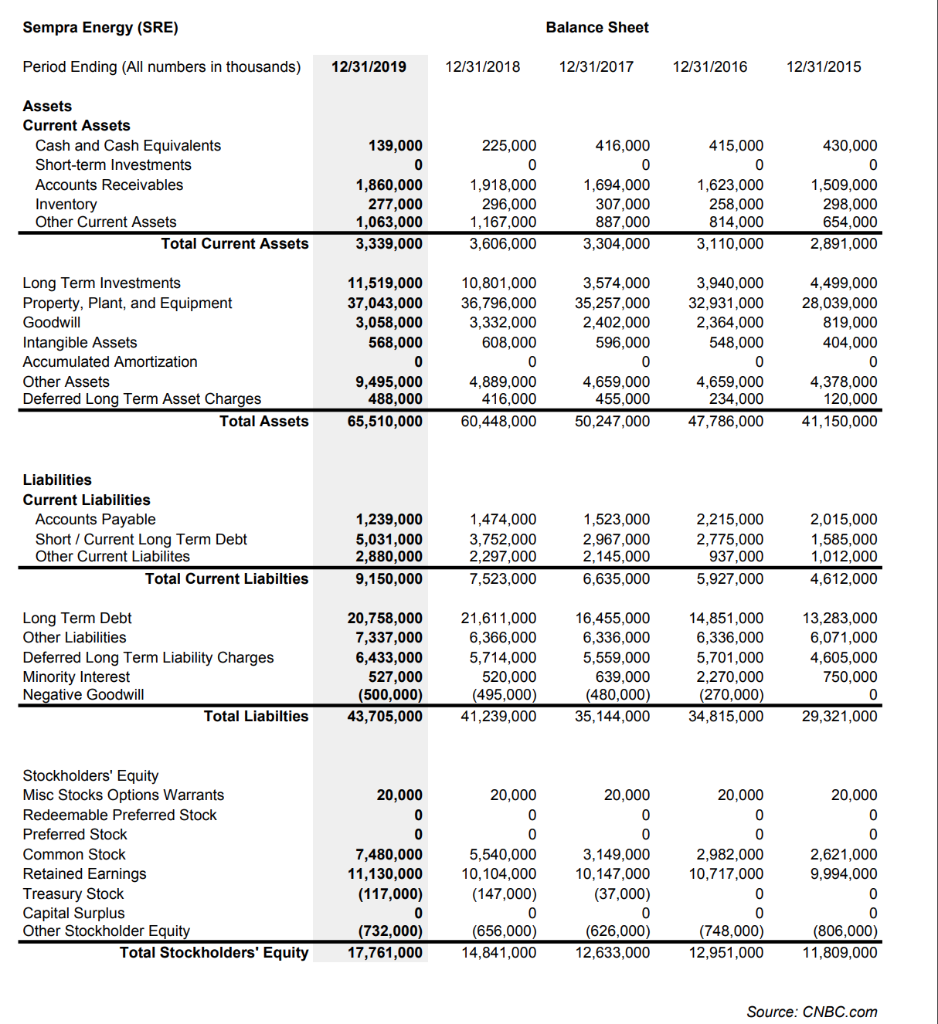 1) Operating Margin 2) Return on Assets (ROA) 3) Return on Equity (ROE, a.k.a. Return on Investments, ROI) 4) Current Ratio
Sempra Energy (SRE) Income Statement Period Ending (All numbers in thousands) 12/31/2019 12/31/2018 12/31/2017 12/31/2016 12/31/2015 Revenue Total Revenue (a.k.a. net sales, annual sales, the "top line") Cost of Revenue Gross Profit 10,817,000 4,103,000 6,714,000 11,661,000 5,229,000 6,432,000 11,191,000 5,272,000 5,919,000 10,201,000 5,223,000 4,978,000 10,189,000 5,128,000 5,061,000 Operating Expenses Research and Development Selling, General, and Administrative Non Recurring Others 3,466,000 0 3,117,000 3,308,000 2,969,000 2,896,000 496,000 3,962,000 Total Operating Expenses 472,000 3,780,000 436,000 3,553,000 426,000 3,395,000 423,000 3,319,000 Operating Income (Loss) 2,752,000 2,652,000 2,366,000 1,583,000 1,742,000 Income from Continuing Operations Total Other Income / Expenses Net Earnings Before Interest and Taxes Interest Expense Income Before Tax Income Tax Expense Minority Interest Net Income from Continuing Operations 1,099,000 3,851,000 1,433,000 1,734,000 (315,000) (148,000) 2,197,000 479,000 2,173,000 1,127,000 1,046,000 (79,000) 76,000 1,049,000 302,000 2,064,000 514,000 1,550,000 389,000 34,000 1,127,000 292,000 1,875,000 553,000 1,322,000 389,000 (438,000) 1,371,000 225,000 1,967,000 561,000 1,406,000 341,000 (285,000) 1,350,000 Non-recurring Events Discontinued Operations Extraordinary Items Effect of Accounting Changes Other Items (142,000) OOOO Net Income (a.k.a. net profit, the "bottom line") 2,055,000 1,049,000 1,127,000 1,371,000 1,350,000 Source: CNBC.com Sempra Energy (SRE) Balance Sheet Period Ending (All numbers in thousands) 12/31/2019 12/31/2018 12/31/2017 12/31/2016 12/31/2015 139,000 225,000 416,000 415,000 430,000 Assets Current Assets Cash and Cash Equivalents Short-term Investments Accounts Receivables Inventory Other Current Assets Total Current Assets 1,860,000 277,000 1,063,000 3,339,000 1,918,000 296,000 1,167,000 3,606,000 1,694,000 307,000 887,000 3,304,000 1,623,000 258,000 814,000 3,110,000 1,509,000 298,000 654,000 2,891,000 11,519,000 37,043,000 3,058,000 568,000 10,801,000 36,796,000 3,332,000 608,000 3,940,000 32,931,000 2,364,000 548,000 4,499,000 28,039,000 819,000 404,000 Long Term Investments Property, Plant, and Equipment Goodwill Intangible Assets Accumulated Amortization Other Assets Deferred Long Term Asset Charges Total Assets 3,574,000 35,257,000 2,402,000 596,000 0 4,659,000 455,000 50,247,000 9,495,000 488,000 65,510,000 4,889,000 416,000 60,448,000 4,659,000 234,000 47,786,000 4,378,000 120,000 41,150,000 00 Liabilities Current Liabilities Accounts Payable Short / Current Long Term Debt Other Current Liabilites Total Current Liabilties 1,239,000 5,031,000 2,880,000 9,150,000 1,474,000 3,752,000 2,297,000 7,523,000 1,523,000 2,967,000 2,145,000 6,635,000 2,215,000 2,775,000 937,000 5,927,000 2.015,000 1.585.000 1,012,000 4,612,000 Long Term Debt Other Liabilities Deferred Long Term Liability Charges Minority Interest Negative Goodwill Total Liabilties 20,758,000 7,337,000 6,433,000 527,000 (500,000) 43,705,000 21,611,000 6,366,000 5,714,000 520,000 (495,000) 41,239,000 16,455,000 6,336,000 5,559,000 639,000 (480,000) 35, 144,000 14,851,000 6,336,000 5,701,000 2,270.000 (270,000) 34,815,000 13,283,000 6,071,000 4,605,000 750,000 29,321,000 20,000 20,000 20,000 20,000 20,000 Stockholders' Equity Misc Stocks Options Warrants Redeemable Preferred Stock Preferred Stock Common Stock Retained Earnings Treasury Stock Capital Surplus Other Stockholder Equity Total Stockholders' Equity 7,480,000 11,130,000 (117,000) 5,540,000 10,104,000 (147,000) 3,149,000 10,147,000 (37,000) 2,982,000 10,717,000 2,621,000 9,994,000 (732,000) 17,761,000 (656,000) 14,841,000 (626,000) 12,633,000 (748,000) 12,951,000 (806,000) 11,809,000 Source: CNBC.com