Show calculations for:
Asset turnover, Profit margin, Return on common stockholders equity, Debt to total assets, Times interest earned
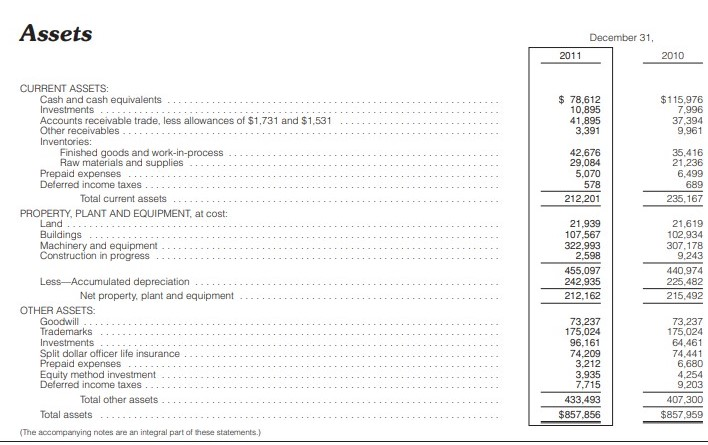
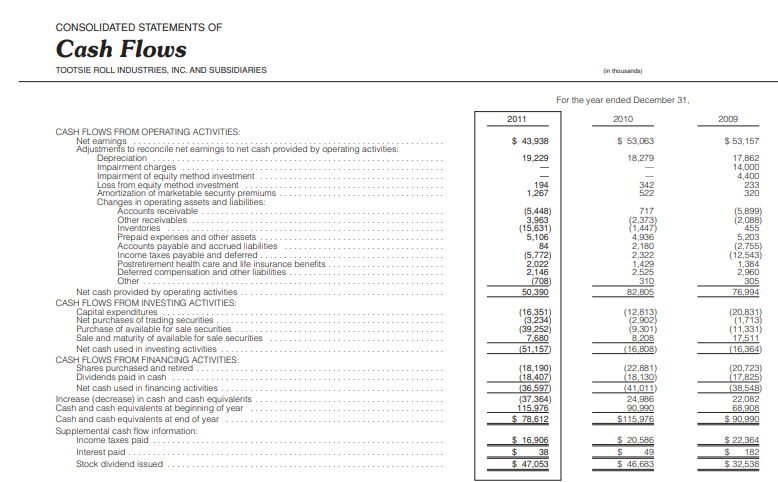
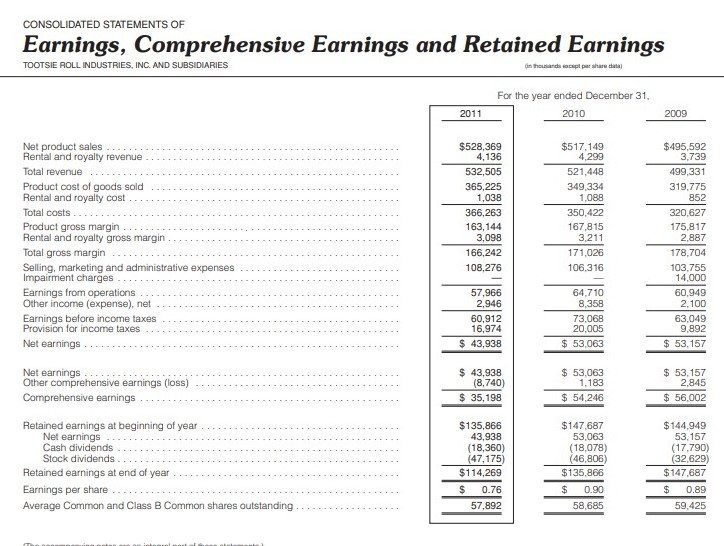
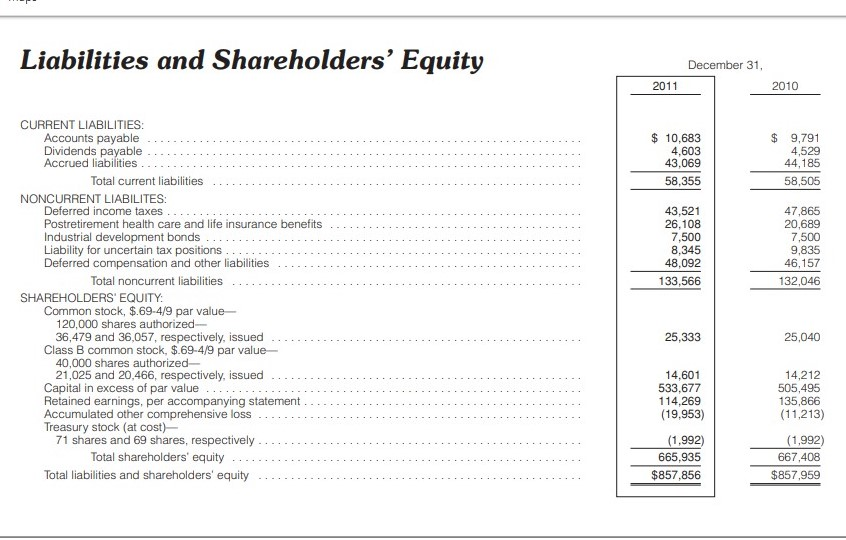
Assets December 31 2011 2010 $ 78,612 10,895 41,895 3,391 $115,976 7.996 37,394 9.961 CURRENT ASSETS: Cash and cash equivalents Investments Accounts receivable trade, less allowances of $1,731 and $1,531 Other receivables Inventories: Finished goods and work-in-process Raw materials and supplies Prepaid expenses Deferred income taxes Total current assets PROPERTY, PLANT AND EQUIPMENT, at cost: Land Buildings Machinery and equipment Construction in progress 42.676 29.084 5.070 35,416 21.236 6.499 689 235,167 578 212,201 21,939 107,567 322.993 2,598 455,097 242.935 212.162 21,619 102.934 307.178 9,243 440,974 225,482 215,492 Less-Accumulated depreciation Net property, plant and equipment OTHER ASSETS: Goodwill Trademarks Investments Split dollar officer life insurance Prepaid expenses Equity method investment Deferred income taxes Total other assets Total assets (The accompanying notes are an integral part of these statements.) 73,237 175.024 96,161 74,209 3.212 3.935 7.715 433,493 $857,856 73,237 175.024 64.461 74,441 6.680 4.254 9,203 407.300 $857,959 CONSOLIDATED STATEMENTS OF Cash Flows TOOTSIE ROLL INDUSTRIES, INC. AND SUBSIDIARIES in thousands For the year ended December 31, 2010 2011 2009 $ 53,157 $ 43.938 19.229 $ 53,063 18,279 17,862 14.000 4,400 233 320 194 1.267 342 522 CASH FLOWS FROM OPERATING ACTIVITIES: Net earnings Adjustmenis to reconcile net earnings to net cash provided by operating activities: Depreciation Impairment charges Impairment of equity method investment Loss from equity method investment Amortization of marketable security premiums Changes in operating assets and liabilities: Accounts receivable Other receivables Inventories Prepaid expenses and other assets Accounts payable and accrued liabilities Income taxes payable and deferred Postretirement health care and life insurance benefits Deferred compensation and other liabilities Other Net cash provided by operating activities CASH FLOWS FROM INVESTING ACTIVITIES: Capital expenditures Net purchases of trading securities Purchase of available for sale securities Sale and maturity of available for sale securities Net cash used in investing activities CASH FLOWS FROM FINANCING ACTIVITIES: Shares purchased and retired Dividends paid in cash Net cash used in financing activities Increase (decrease) in cash and cash equivalents Cash and cash equivalents at beginning of year Cash and cash equivalents at end of year Supplemental cash flow information: Income taxes paid Interest paid Stock dividend issued (5.448) 3.963 (15.631) 5,106 84 (5.772) 2.022 2.146 (708) 50,390 717 (2.373) (1,447) 4,936 2,180 2.322 1.429 2.525 310 82.805 (5,899) (2,088) 455 5,203 (2.755) (12.543) 1,384 2.960 305 76,994 (16.351 (3.234) (39.252) 7.680 (51.157 (12.813 (2.902) (9,301) 8.208 16.808 (20,831 (1,713) (11.331) 17.511 (16,364 (18,190 18.407 36.597 (37.364) 115.976 $ 78.612 (22,881 18.130 (41,011 24,986 904980 $115,976 (20.723) (17,825 (38,548) 22,082 68,90B $ 90,990 $16.906 $ 38 $ 47,053 $ 20,586 $ 49 $ 46,683 $ 22,364 $ 182 $ 32,538 CONSOLIDATED STATEMENTS OF Earnings, Comprehensive Earnings and Retained Earnings TOOTSIE ROLL INDUSTRIES, INC. AND SUBSIDIARIES in thousands op par share data For the year ended December 31, 2010 2011 2009 Net product sales Rental and royalty revenue Total revenue Product cost of goods sold Rental and royalty cost Total costs Product gross margin Rental and royalty gross margin Total gross margin Selling, marketing and administrative expenses Impairment charges Earnings from operations Other income (expense), net Earnings before income taxes Provision for income taxes Net earnings $528,369 4,136 532,505 365,225 1,038 366,263 163,144 3,098 166,242 108,276 $517,149 4.299 521,448 349,334 1.088 350.422 167.815 3,211 171.026 106,316 $495,592 3,739 499 331 319,775 852 320,627 175,817 2.887 178,704 103.755 14.000 60,949 2.100 63.049 9.892 $ 53,157 57,966 2.946 60,912 16,974 $ 43,938 64.710 8,358 73.068 20.005 $ 53,063 Net earnings Other comprehensive earnings (loss) Comprehensive earnings $ 43,938 (8,740) $ 35,198 $ 53,063 1.183 $ 54,246 $ 53,157 2,845 $ 56,002 Retained earnings at beginning of year Net earnings Cash dividends Stock dividends Retained earnings at end of year Earnings per share ...... Average Common and Class B Common shares outstanding $135,866 43,938 (18,360) (47,175) $114,269 $ 0.76 57,892 $147,687 53.063 (18,078) (46.806) $135,866 $ 0.90 58,685 $144.949 53,157 (17.790) (32.629) $147,687 $ 0.89 59,425 Liabilities and Shareholders' Equity December 31, 2011 2010 $ 10,683 4,603 43,069 58,355 $ 9,791 4,529 44,185 58,505 43,521 26,108 7,500 8,345 48,092 133,566 47,865 20,689 7,500 9.835 46,157 132,046 CURRENT LIABILITIES: Accounts payable Dividends payable Accrued liabilities Total current liabilities NONCURRENT LIABILITES: Deferred income taxes Postretirement health care and life insurance benefits Industrial development bonds Liability for uncertain tax positions Deferred compensation and other liabilities Total noncurrent liabilities SHAREHOLDERS' EQUITY: Common stock, $.69-4/9 par value 120,000 shares authorized 36,479 and 36,057, respectively, issued Class B common stock, $.69-4/9 par value 40,000 shares authorized- 21,025 and 20,466, respectively, issued Capital in excess of par value Retained earnings, per accompanying statement Accumulated other comprehensive loss Treasury stock (at cost) 71 shares and 69 shares, respectively Total shareholders' equity Total liabilities and shareholders' equity 25,333 25,040 14,601 533,677 114,269 (19,953) 14,212 505,495 135,866 (11,213) (1,992) 665,935 $857,856 (1,992) 667,408 $857,959