

Answered step by step
Verified Expert Solution
Question
1 Approved Answer
Show formulas used in each highlighted cell. Calculate portfolio statistics Percentage in BA 60.00% Percentage in K 40.00% Expected portfolio return, E (r_p) Portfolio variance,
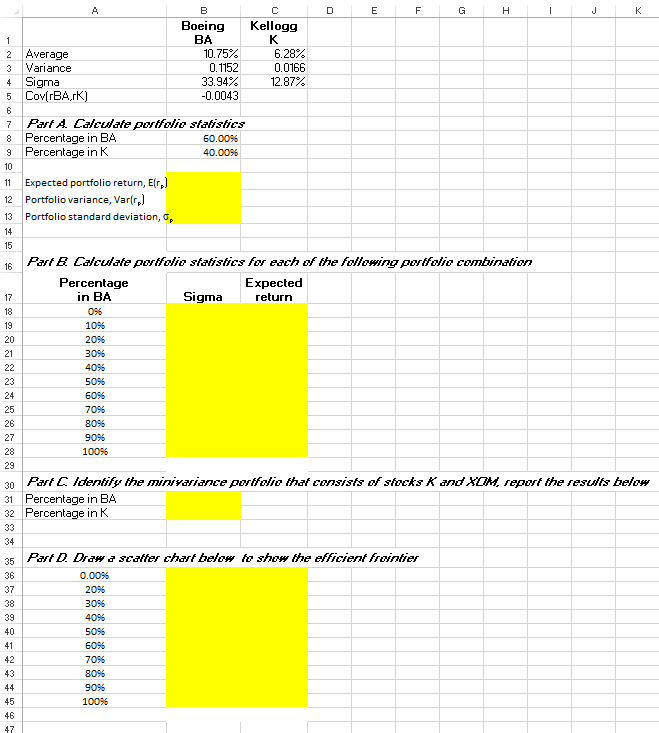
Show formulas used in each highlighted cell.
Calculate portfolio statistics Percentage in BA 60.00% Percentage in K 40.00% Expected portfolio return, E (r_p) Portfolio variance, Var (r_p) Portfolio standard deviation, sigma_p Calculate portfolio statistics for each of the following portfolio combination Percentage in BA Sigma Expected return 0% 10% 20% 30% 40% 50% 60% 70% 80% 90% 100% Identify the invariance portfolio that consists of stocks K and XOM. report the results below Percentage in BA Percentage in K Draw a scatter chart below to show the efficient frontier 0.00% 20% 30% 40% 50% 60% 70% 80% 90% 100%Step by Step Solution
There are 3 Steps involved in it
Step: 1

Get Instant Access to Expert-Tailored Solutions
See step-by-step solutions with expert insights and AI powered tools for academic success
Step: 2

Step: 3
Ace Your Homework with AI
Get the answers you need in no time with our AI-driven, step-by-step assistance
Get Started
M Finance
Authors: Marcia Cornett, Troy Adair, John Nofsinger
3rd Edition
0077861779, 978-0077861773