

Answered step by step
Verified Expert Solution
Question
1 Approved Answer
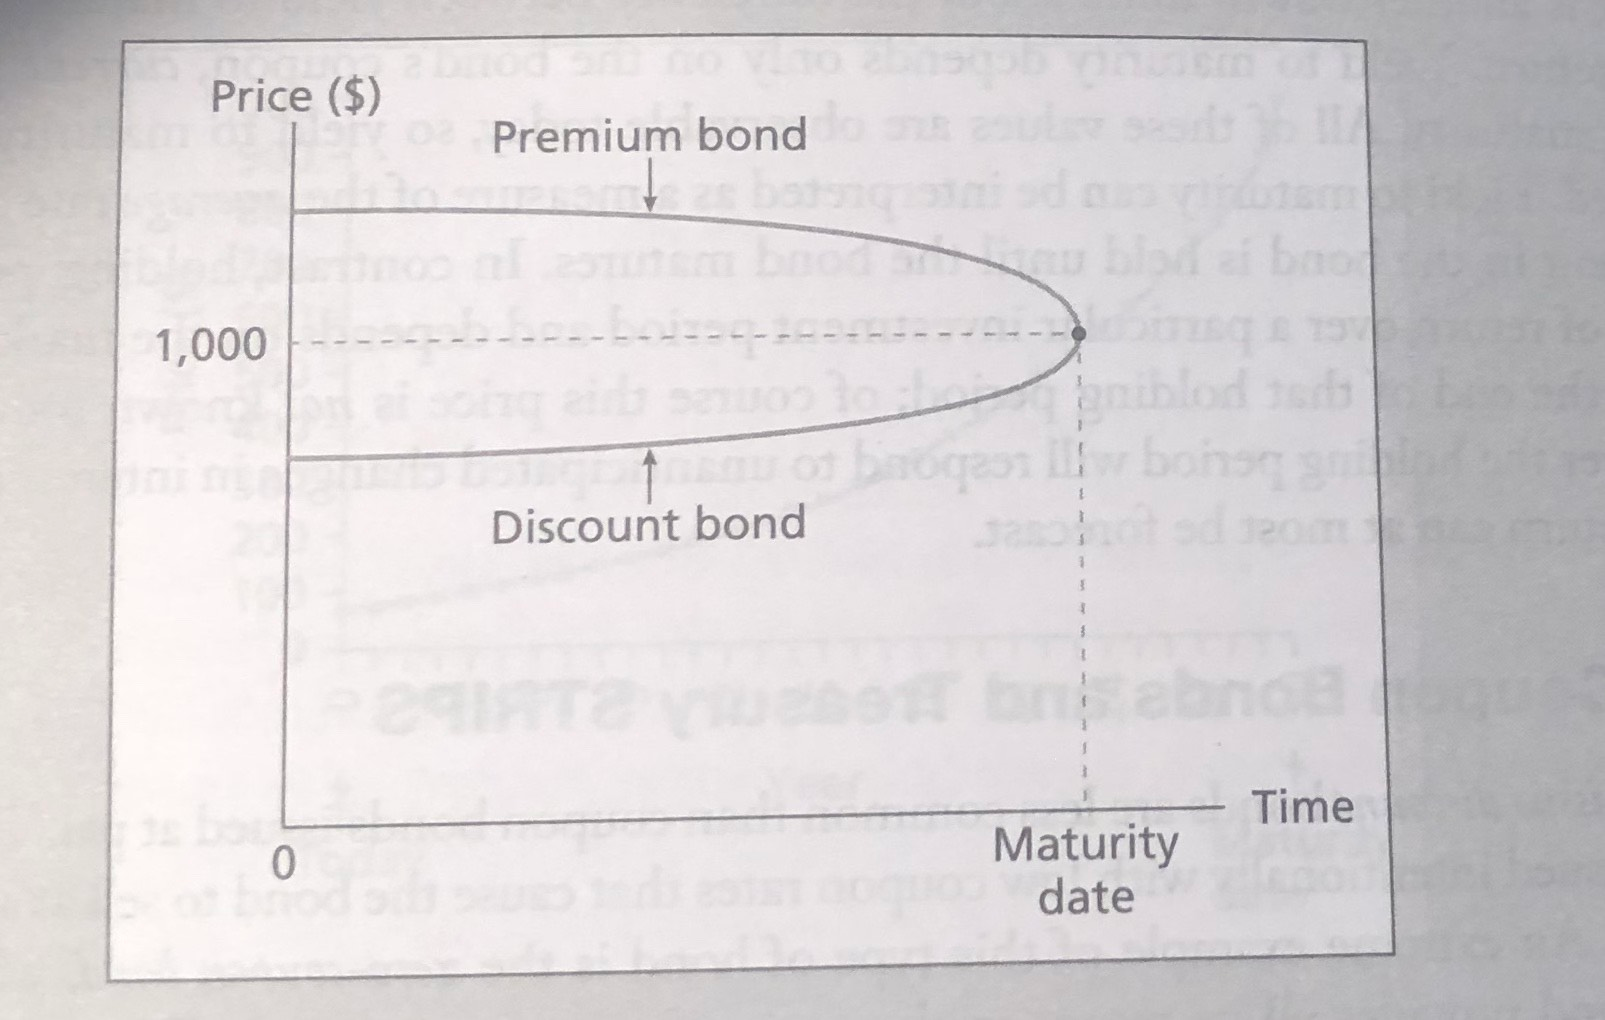
Show how you can replicate these two graphs in excel 1,000 900 Price ($) 800- 700- 600 - 500 400 300- 200 100 Year Today
Show how you can replicate these two graphs in excel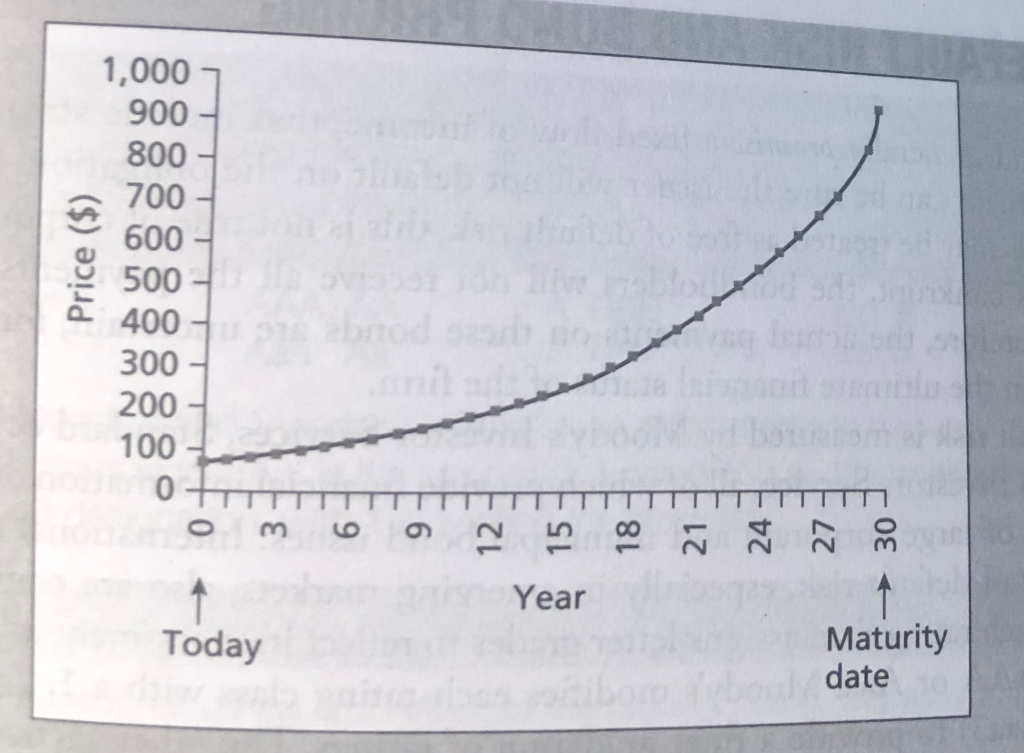
Step by Step Solution
There are 3 Steps involved in it
Step: 1

Get Instant Access to Expert-Tailored Solutions
See step-by-step solutions with expert insights and AI powered tools for academic success
Step: 2

Step: 3
Ace Your Homework with AI
Get the answers you need in no time with our AI-driven, step-by-step assistance
Get Started
Investments An Introduction
Authors: Herbert B Mayo
9th Edition
324561385, 978-0324561388