

Question
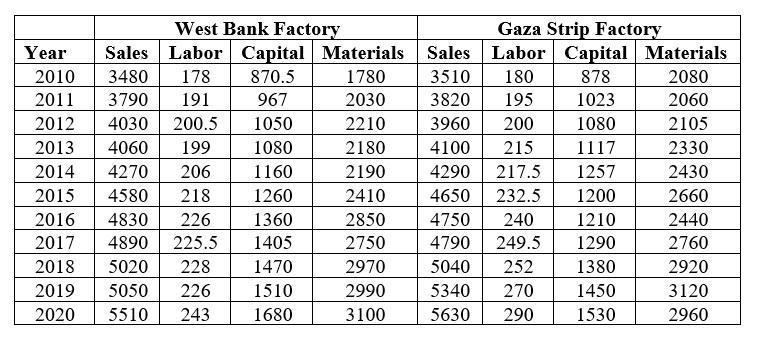
Show me Calculations please ! A company has collected the data as shown in the table below for the factories it operates. The plants are
Show me Calculations please !
A company has collected the data as shown in the table below for the factories it operates. The plants are of similar size and capacity. All data are in thousands of US$. a- Calculate the labor, capital and multifactor (including, labor, capital and materials) productivity for each plant for all years. b- Using the data in the table, plot plant As and Bs labor productivity on the same graph. c- Using the data in the table, plot plant As and Bs capital productivity on the same graph. d- Using the data in the table, plot plant As and Bs multifactor productivity on the same graph. e- Evaluate each factorys performance overtime both independent of the other factory and relative to the other factory, what would you recommend? West Bank Factory Gaza Strip Factory Year Sales Labor Capital Materials Sales Labor Capital Materials
Step by Step Solution
There are 3 Steps involved in it
Step: 1

Get Instant Access to Expert-Tailored Solutions
See step-by-step solutions with expert insights and AI powered tools for academic success
Step: 2

Step: 3
Ace Your Homework with AI
Get the answers you need in no time with our AI-driven, step-by-step assistance
Get Started
Bitcoin Technical Innovations From The Trenches
Authors: Sjors Provoost
1st Edition
9090360425, 978-9090360423