

Answered step by step
Verified Expert Solution
Question
1 Approved Answer
Show step by step on Excel 3. (Descriptive statistics) Here is the monthly stock price data for Ford and GM: A B 1 PRICES FOR
Show step by step on Excel 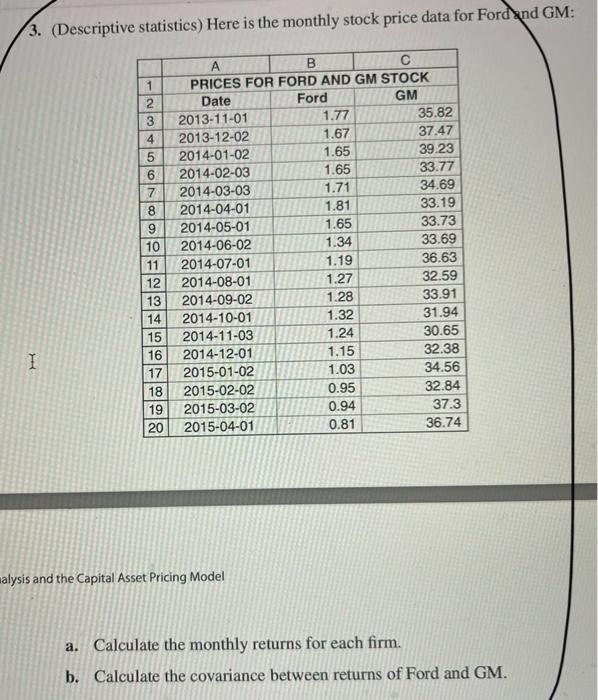
3. (Descriptive statistics) Here is the monthly stock price data for Ford and GM: A B 1 PRICES FOR FORD AND GM STOCK 2 Date Ford GM 3 2013-11-01 1.77 35.82 4 2013-12-02 1.67 37.47 5 2014-01-02 1.65 39.23 6 2014-02-03 1.65 33.77 2014-03-03 1.71 34.69 8 2014-04-01 1.81 33.19 9 2014-05-01 1.65 33.73 10 2014-06-02 1.34 33.69 11 2014-07-01 1.19 36.63 12 2014-08-01 1.27 32.59 13 2014-09-02 1.28 33.91 14 2014-10-01 1.32 31.94 15 2014-11-03 1.24 30.65 16 2014-12-01 1.15 I 32.38 17 2015-01-02 1.03 34.56 18 2015-02-02 0.95 32.84 19 2015-03-02 0.94 37.3 20 2015-04-01 0.81 36.74 malysis and the Capital Asset Pricing Model a. Calculate the monthly returns for each firm. b. Calculate the covariance between returns of Ford and GM Step by Step Solution
There are 3 Steps involved in it
Step: 1

Get Instant Access to Expert-Tailored Solutions
See step-by-step solutions with expert insights and AI powered tools for academic success
Step: 2

Step: 3
Ace Your Homework with AI
Get the answers you need in no time with our AI-driven, step-by-step assistance
Get Started
Decision Making In Marketing And Finance An Interdisciplinary Approach To Solving Complex Organizational Problems
Authors: P. Koku
1st Edition
1137379472, 1137444770, 9781137379474, 9781137444776