Answered step by step
Verified Expert Solution
Link Copied!

Question

1 Approved Answer

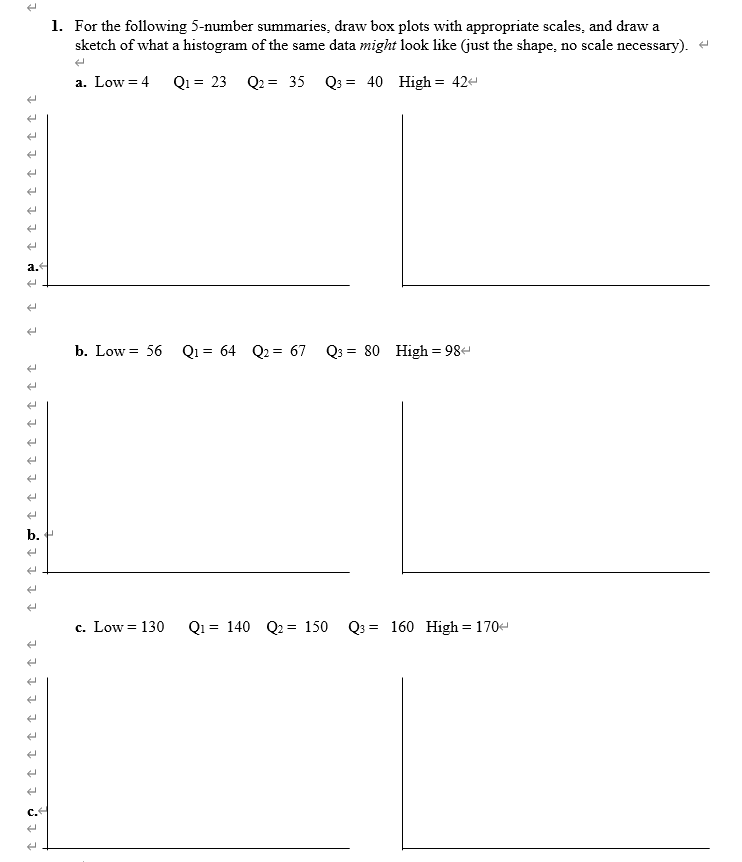
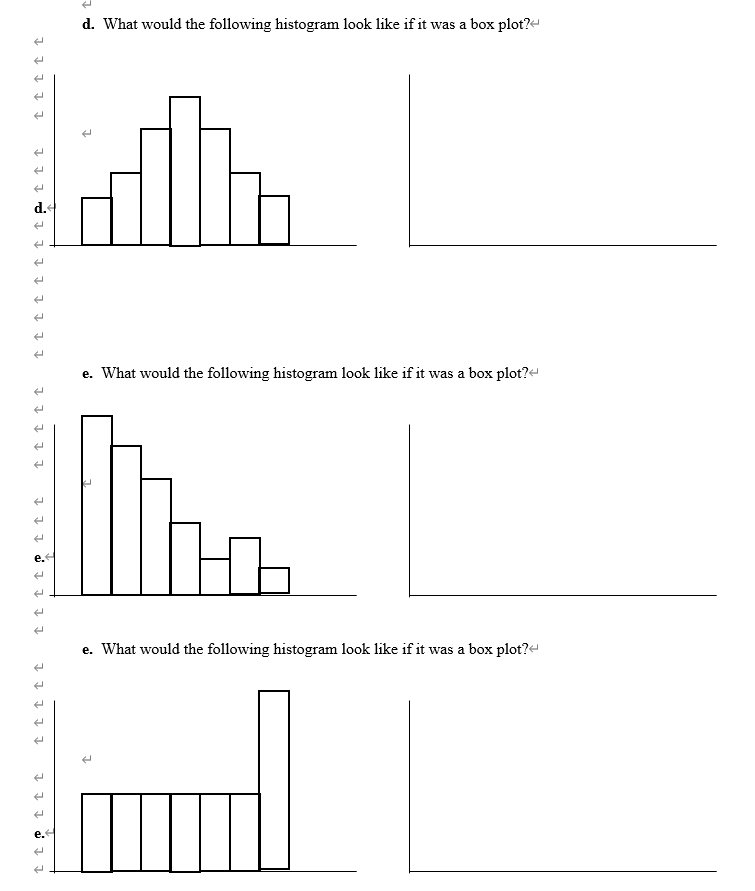
show the steps 1. For the following 5-number summaries, draw box plots with appropriate scales, and draw a sketch of what a histogram of the

show the steps

image text in transcribedimage text in transcribed
1. For the following 5-number summaries, draw box plots with appropriate scales, and draw a sketch of what a histogram of the same data might look like (just the shape, no scale necessary). a. Low =4 Q1 = 23 Q2= 35 Q3= 40 High = 42+ tttttittt ttip b. Low = 56 Q1 = 64 Q2= 67 Q3 = 80 High =98- tttigtittittit c. Low = 130 Q1= 140 Q2= 150 Q3= 160 High =170 thottttittittottt tt t tittott titt ttt titttettt ttttt d. What would the following histogram look like if it was a box plot?- e. What would the following histogram look like if it was a box plot?~ e. What would the following histogram look like if it was a box plot

Step by Step Solution

There are 3 Steps involved in it

Step: 1

blur-text-image

Get Instant Access to Expert-Tailored Solutions

See step-by-step solutions with expert insights and AI powered tools for academic success

Step: 2

blur-text-image

Step: 3

blur-text-image

Ace Your Homework with AI

Get the answers you need in no time with our AI-driven, step-by-step assistance

Get Started

Recommended Textbook for

Finite Math And Applied Calculus

Authors: Stefan Waner, Steven Costenoble

2nd Edition

0534366309, 9780534366308

More Books

Students also viewed these Mathematics questions

Question

What are the inputs to master scheduling? What are the outputs?

Answered: 1 week ago