Show work please
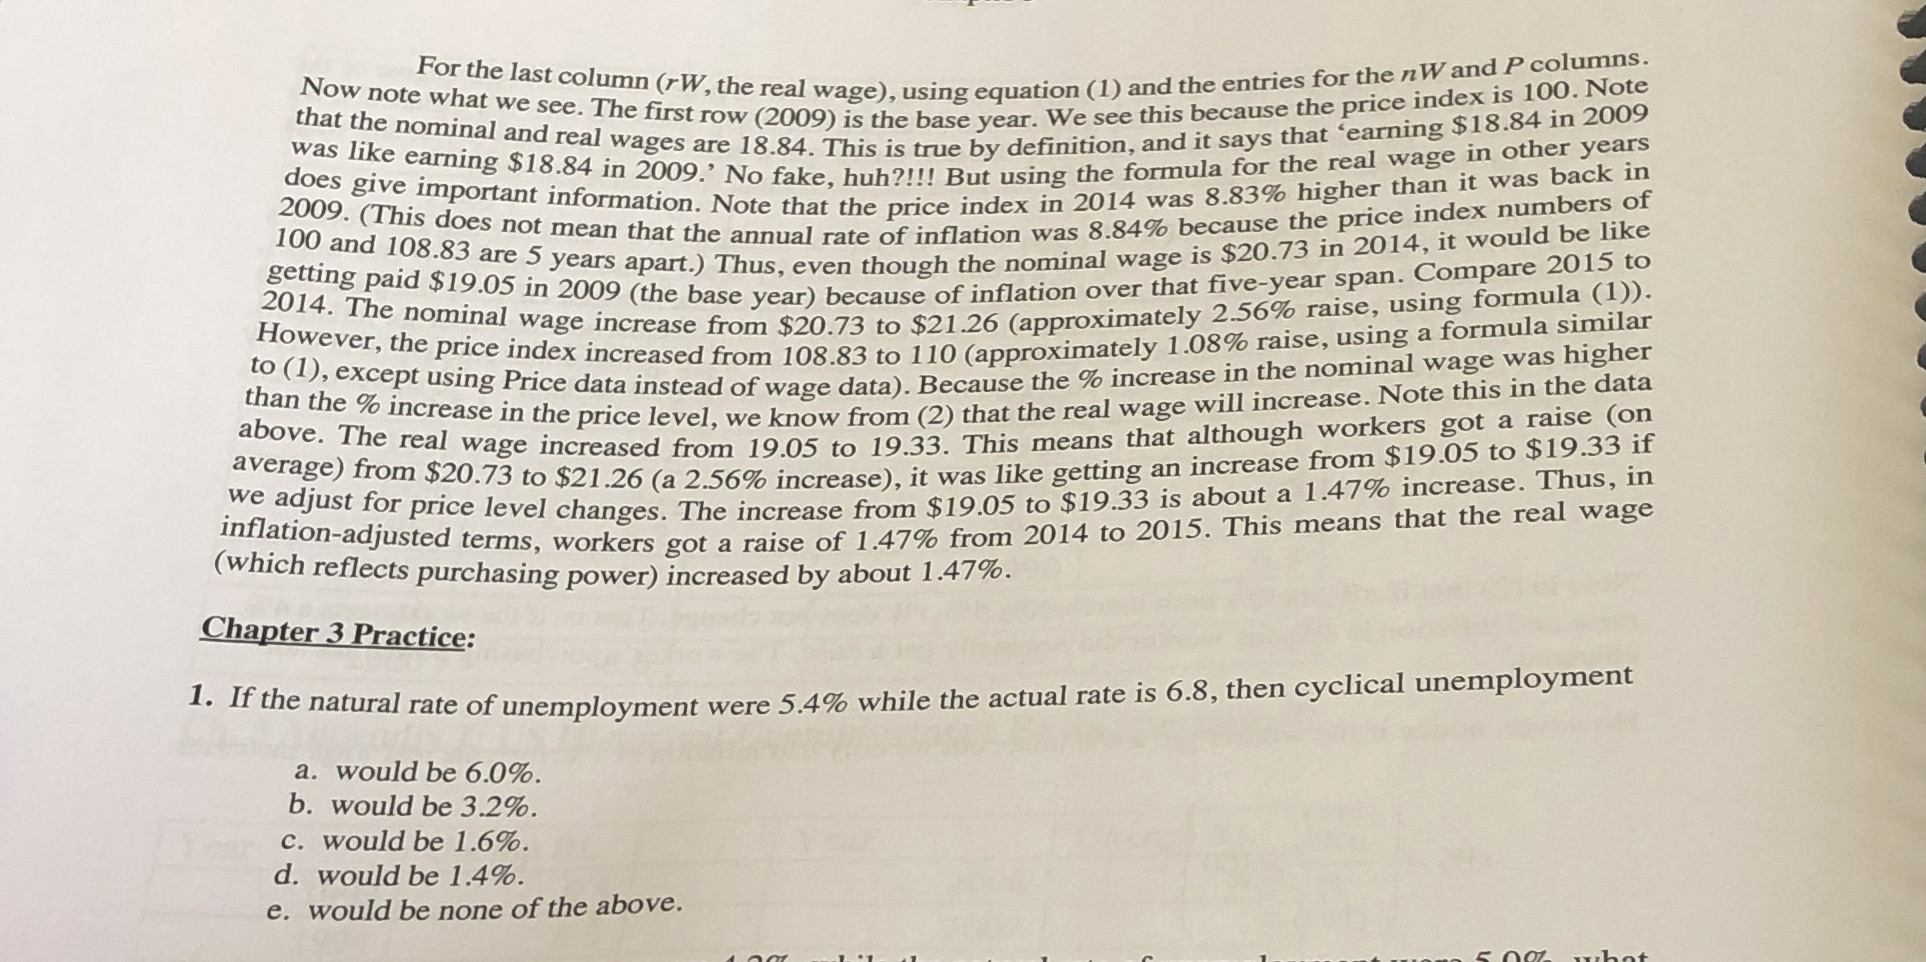
For the last column (rW, the real wage), using equation (1) and the entries for the nW and P columns. Now note what we see. The first row (2009) is the base year. We see this because the price index is 100. Note that the nominal and real wages are 18.84. This is true by definition, and it says that 'earning $18.84 in 2009 was like earning $18.84 in 2009.' No fake, huh?!!! But using the formula for the real wage in other years does give important information. Note that the price index in 2014 was 8.83% higher than it was back in 2009. (This does not mean that the annual rate of inflation was 8.84% because the price index numbers of 100 and 108.83 are 5 years apart.) Thus, even though the nominal wage is $20.73 in 2014, it would be like getting paid $19.05 in 2009 (the base year) because of inflation over that five-year span. Compare 2015 to 2014. The nominal wage increase from $20.73 to $21.26 (approximately 2.56% raise, using formula (1)). However, the price index increased from 108.83 to 110 (approximately 1.08% raise, using a formula similar to (1), except using Price data instead of wage data). Because the % increase in the nominal wage was higher than the % increase in the price level, we know from (2) that the real wage will increase. Note this in the data above. The real wage increased from 19.05 to 19.33. This means that although workers got a raise (on average) from $20.73 to $21.26 (a 2.56% increase), it was like getting an increase from $19.05 to $19.33 if we adjust for price level changes. The increase from $19.05 to $19.33 is about a 1.47% increase. Thus, in inflation-adjusted terms, workers got a raise of 1.47% from 2014 to 2015. This means that the real wage (which reflects purchasing power) increased by about 1.47%. Chapter 3 Practice: 1. If the natural rate of unemployment were 5.4% while the actual rate is 6.8, then cyclical unemployment a. would be 6.0%. b. would be 3.2%. c. would be 1.6%. d. would be 1.4%. e. would be none of the above