

Answered step by step
Verified Expert Solution
Question
1 Approved Answer
(SHOW YOUR COMPLETE WORK) The actual demand data for a product over the past six weeks are shown below: a. Plot the weekly demand data
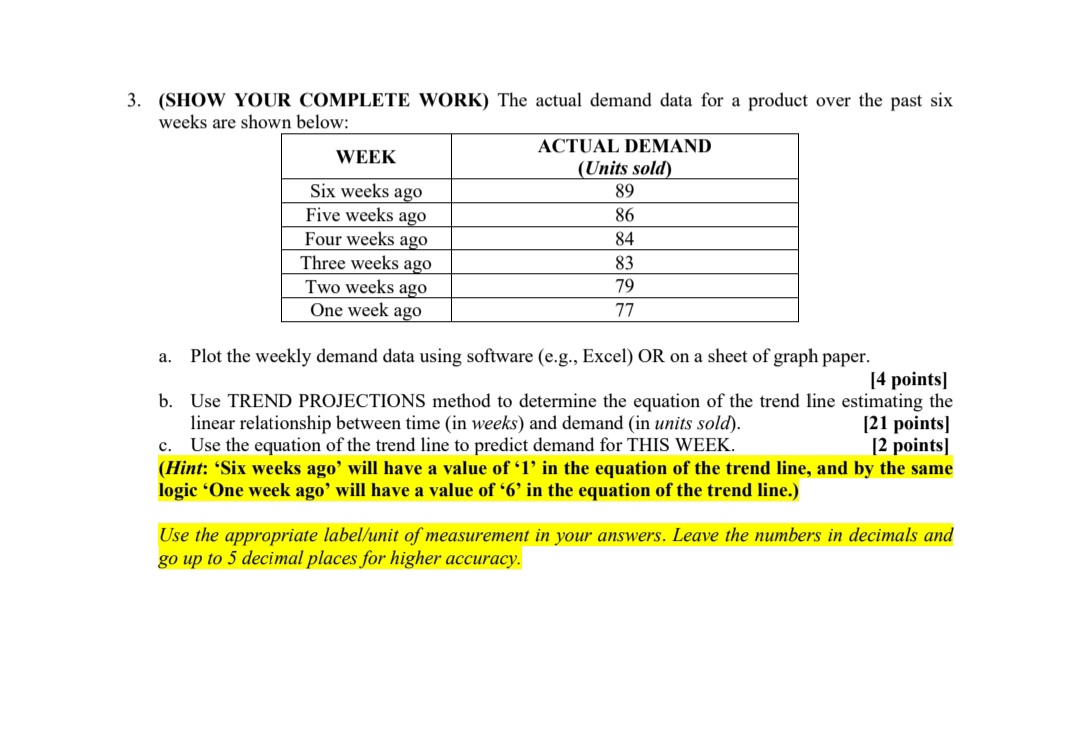 (SHOW YOUR COMPLETE WORK) The actual demand data for a product over the past six weeks are shown below: a. Plot the weekly demand data using software (e.g., Excel) OR on a sheet of graph paper. [4 points] b. Use TREND PROJECTIONS method to determine the equation of the trend line estimating the linear relationship between time (in weeks) and demand (in units sold). [21 points] c. Use the equation of the trend line to predict demand for THIS WEEK. [2 points] (Hint: 'Six weeks ago' will have a value of ' 1 ' in the equation of the trend line, and by the same logic 'One week ago' will have a value of ' 6 ' in the equation of the trend line.) Use the appropriate label/unit of measurement in your answers. Leave the numbers in decimals and go up to 5 decimal places for higher accuracy
 Step by Step Solution
There are 3 Steps involved in it
Step: 1

Get Instant Access to Expert-Tailored Solutions
See step-by-step solutions with expert insights and AI powered tools for academic success
Step: 2

Step: 3
Ace Your Homework with AI
Get the answers you need in no time with our AI-driven, step-by-step assistance
Get Started
Management Fundamentals
Authors: Robert N. Lussier
9th Edition
154438419X, 978-1544384191