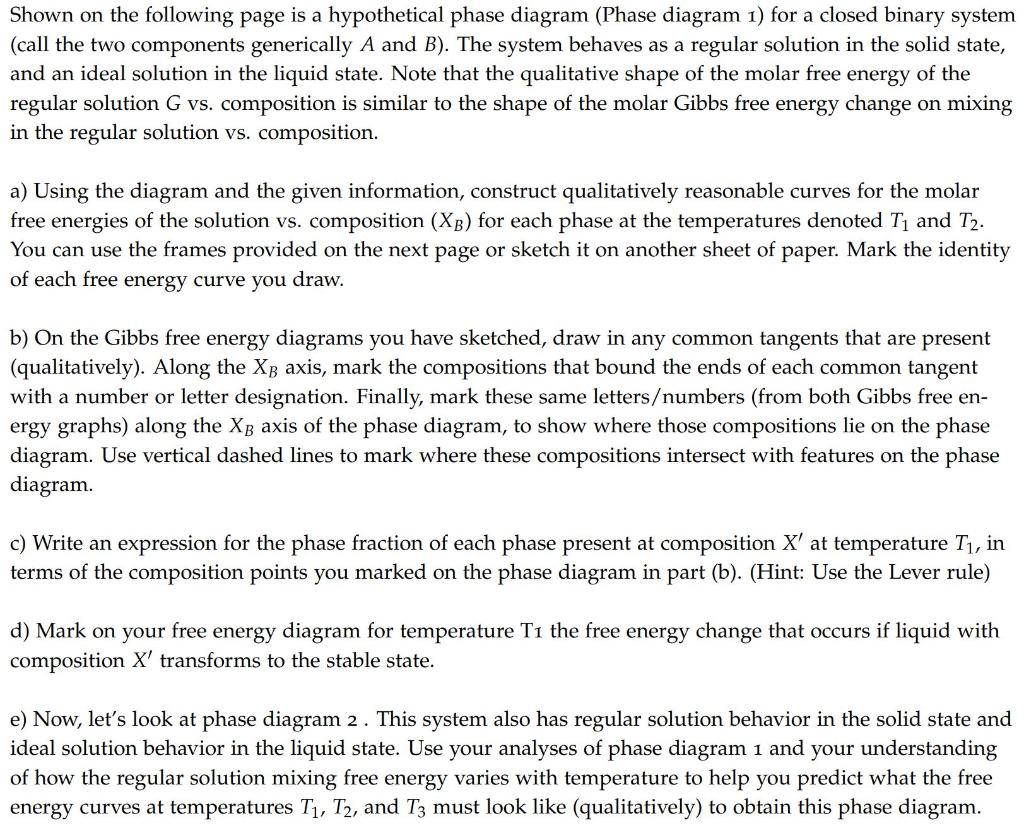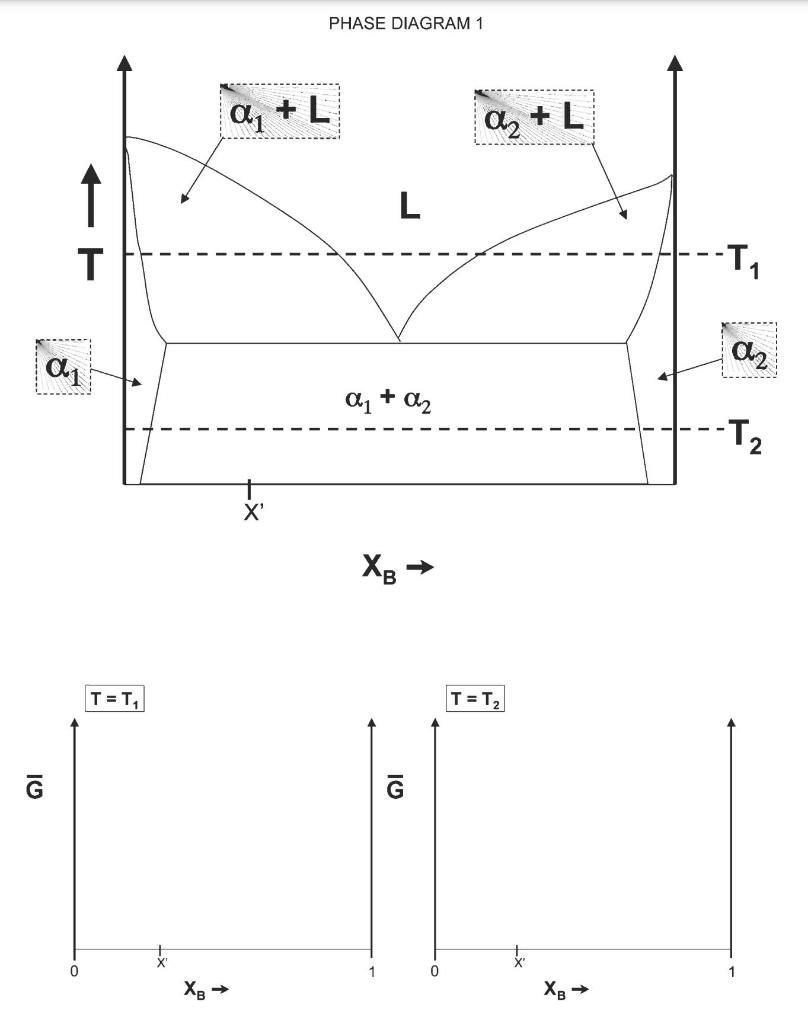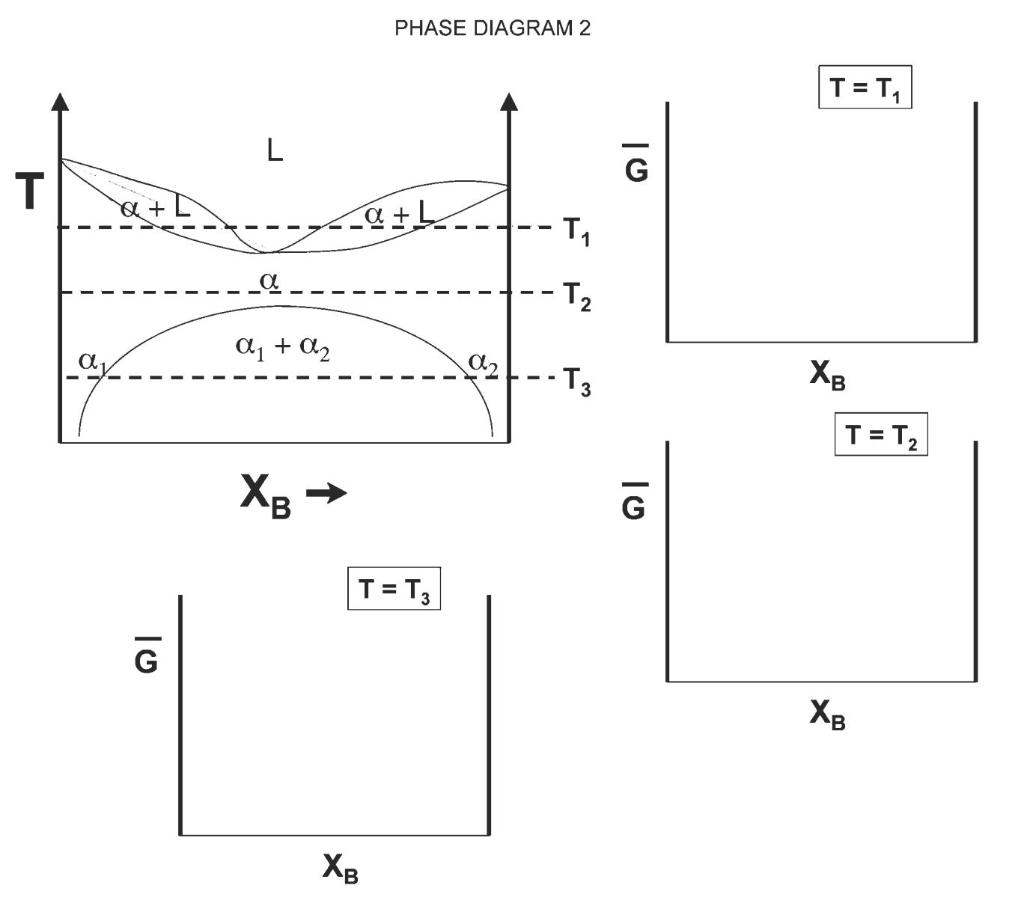


Shown on the following page is a hypothetical phase diagram (Phase diagram 1) for a closed binary system (call the two components generically A and B). The system behaves as a regular solution in the solid state, and an ideal solution in the liquid state. Note that the qualitative shape of the molar free energy of the regular solution G vs. composition is similar to the shape of the molar Gibbs free energy change on mixing in the regular solution vs. composition. a) Using the diagram and the given information, construct qualitatively reasonable curves for the molar free energies of the solution vs. composition (XB) for each phase at the temperatures denoted T1 and T2. You can use the frames provided on the next page or sketch it on another sheet of paper. Mark the identity of each free energy curve you draw. b) On the Gibbs free energy diagrams you have sketched, draw in any common tangents that are present (qualitatively). Along the Xp axis, mark the compositions that bound the ends of each common tangent with a number or letter designation. Finally, mark these same lettersumbers (from both Gibbs free en- ergy graphs) along the XB axis of the phase diagram, to show where those compositions lie on the phase diagram. Use vertical dashed lines to mark where these compositions intersect with features on the phase diagram. c) Write an expression for the phase fraction of each phase present at composition X' at temperature T, in terms of the composition points you marked on the phase diagram in part (b). (Hint: Use the Lever rule) d) Mark on your free energy diagram for temperature T1 the free energy change that occurs if liquid with composition X' transforms to the stable state. e) Now, let's look at phase diagram 2 . This system also has regular solution behavior in the solid state and ideal solution behavior in the liquid state. Use your analyses of phase diagram 1 and your understanding of how the regular solution mixing free energy varies with temperature to help you predict what the free energy curves at temperatures T1, T2, and T3 must look like (qualitatively) to obtain this phase diagram. PHASE DIAGRAM 1 a, + L az + L 1 L L T T a2 ali a1 + a2 - T2 N X XB T = T T = T 10 0 1 0 XB 1 XB PHASE DIAGRAM 2 TET, L G T + {+b -- -T7 La -T2 a1 + A2 A2 -T3 XB T = T2 XB G T = T3 G XB XB


