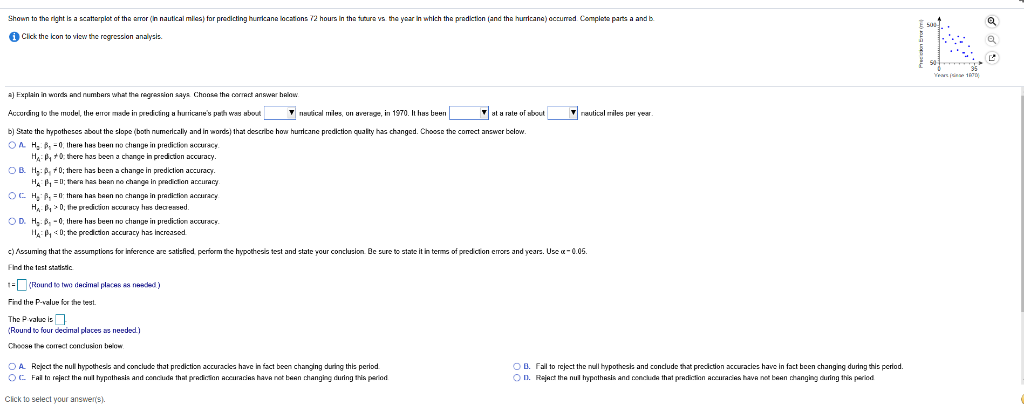

Shown to the richt ls a scatta plot at the mor n nautical mies} tor predicting hurricana locations2 hours in the tur vs the yaar n which the pradiction land the hurricane)occumed Complete parts a and b Click the kon to view the rngression analysl a) Explain in wind and number what th regresion says Chansatha oorret answver taiw Accurding to hve mudel, theerror made in predicting hurmane's psh wa" Hbout nsucal miles, on average, in 1970 . It been at a rale of about nauticl miles per year b) State te hypotheses about the slope (both numerically and in ords, lhat descrte how hurricane prediction qualty has changed. Choose the comect answer below. HA: p-0: there has been change n predicion accuracy. B. H:P 0;there has been a change in prediction accuracy. Ha 11,-D; thera has been no chargin predicton anciracy D H B-0, there has been no change in prediction accuracy PD;he predicion accuracy has Increased cJAssumng that the assumptions for n erence are satisfied penorm hypothes test and state your conclusion Be sure to state it n terms of predcton errorsand years. Use -0.05. Frd the tst stasic Find the P-valuefor the test. The P valuc is Round to four decimal places as needed OA Rejcct the nul hypothesis and conclude that prediction accuracks havc infact been changing during this period B. Fal to rject the nul hypothesl and condude that preciction accuracies have in fact been changing during this period On. Rejact the nul hypethesis and conckuda that pradictien acuracies hava not bean changing curing ths paried C. Fal to rejart the nul typathRA and tencuda that pradinan araciAG hava ret bean changing during this period Cick to select your answen's). correct d) Explain what the R-squared means in terms of this regression. Choose the answer below. The value of R-squared is the percentage of variability in the predicted value that is accounted for by knowing the value of the predictor variable 0 A. The value of R-squared is the approximate percentage of data points that lie along the regression line. O B. The value of R-squared is the percentage of variability in the predicted error in hurricane location that is accounted for by knowing the number of years since 1970 O C. The value of R-squared is the approximate percentage of predicted values that will match the exact values in the data set. D. The value o R-squared s the percentage o variability in the predicted number o years since 1970 that is accounted or by know ng the error um ane ocation. Click to select your answer(s) Shown to the richt ls a scatta plot at the mor n nautical mies} tor predicting hurricana locations2 hours in the tur vs the yaar n which the pradiction land the hurricane)occumed Complete parts a and b Click the kon to view the rngression analysl a) Explain in wind and number what th regresion says Chansatha oorret answver taiw Accurding to hve mudel, theerror made in predicting hurmane's psh wa" Hbout nsucal miles, on average, in 1970 . It been at a rale of about nauticl miles per year b) State te hypotheses about the slope (both numerically and in ords, lhat descrte how hurricane prediction qualty has changed. Choose the comect answer below. HA: p-0: there has been change n predicion accuracy. B. H:P 0;there has been a change in prediction accuracy. Ha 11,-D; thera has been no chargin predicton anciracy D H B-0, there has been no change in prediction accuracy PD;he predicion accuracy has Increased cJAssumng that the assumptions for n erence are satisfied penorm hypothes test and state your conclusion Be sure to state it n terms of predcton errorsand years. Use -0.05. Frd the tst stasic Find the P-valuefor the test. The P valuc is Round to four decimal places as needed OA Rejcct the nul hypothesis and conclude that prediction accuracks havc infact been changing during this period B. Fal to rject the nul hypothesl and condude that preciction accuracies have in fact been changing during this period On. Rejact the nul hypethesis and conckuda that pradictien acuracies hava not bean changing curing ths paried C. Fal to rejart the nul typathRA and tencuda that pradinan araciAG hava ret bean changing during this period Cick to select your answen's). correct d) Explain what the R-squared means in terms of this regression. Choose the answer below. The value of R-squared is the percentage of variability in the predicted value that is accounted for by knowing the value of the predictor variable 0 A. The value of R-squared is the approximate percentage of data points that lie along the regression line. O B. The value of R-squared is the percentage of variability in the predicted error in hurricane location that is accounted for by knowing the number of years since 1970 O C. The value of R-squared is the approximate percentage of predicted values that will match the exact values in the data set. D. The value o R-squared s the percentage o variability in the predicted number o years since 1970 that is accounted or by know ng the error um ane ocation. Click to select your answer(s)