

Answered step by step
Verified Expert Solution
Question
1 Approved Answer
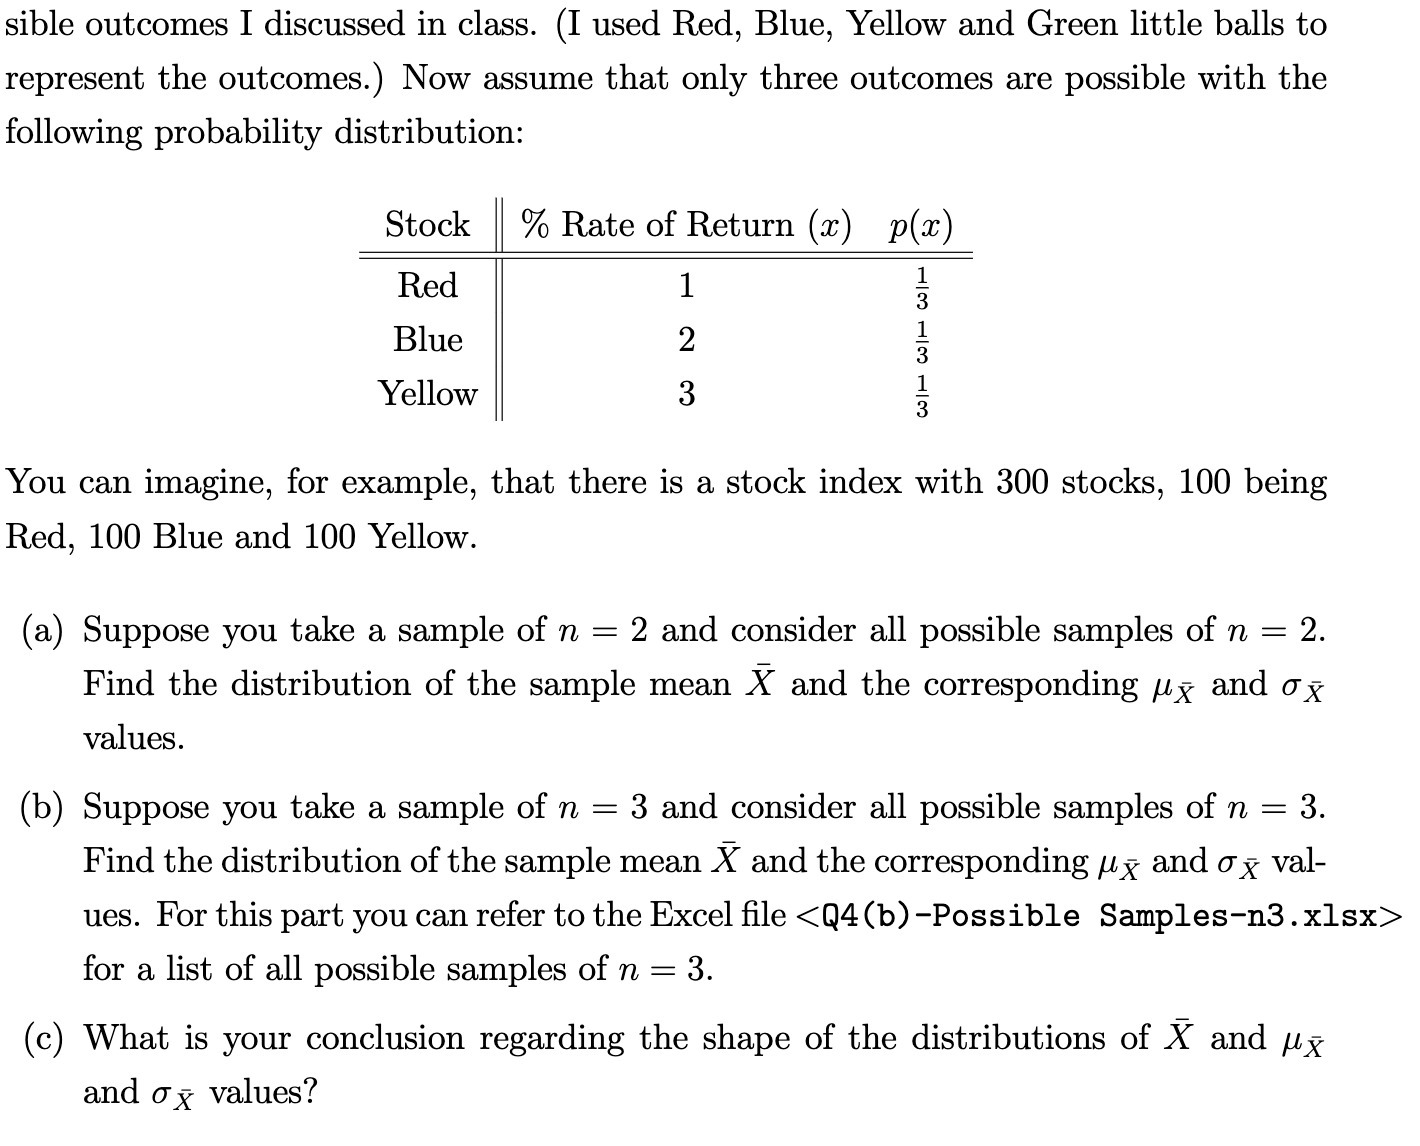
sible outcomes I discussed in class. (I used Red, Blue, Yellow and Green little balls to represent the outcomes.) Now assume that only three outcomes
Step by Step Solution
There are 3 Steps involved in it
Step: 1

Get Instant Access to Expert-Tailored Solutions
See step-by-step solutions with expert insights and AI powered tools for academic success
Step: 2

Step: 3
Ace Your Homework with AI
Get the answers you need in no time with our AI-driven, step-by-step assistance
Get Started
Advanced Engineering Mathematics
Authors: ERWIN KREYSZIG
9th Edition
0471488852, 978-0471488859