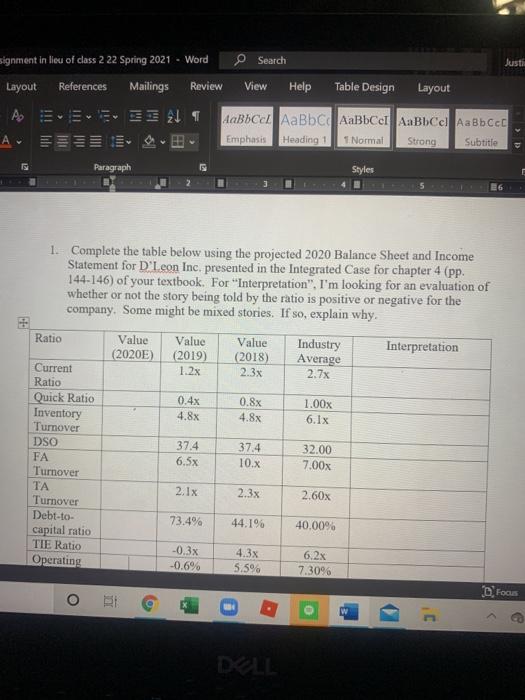
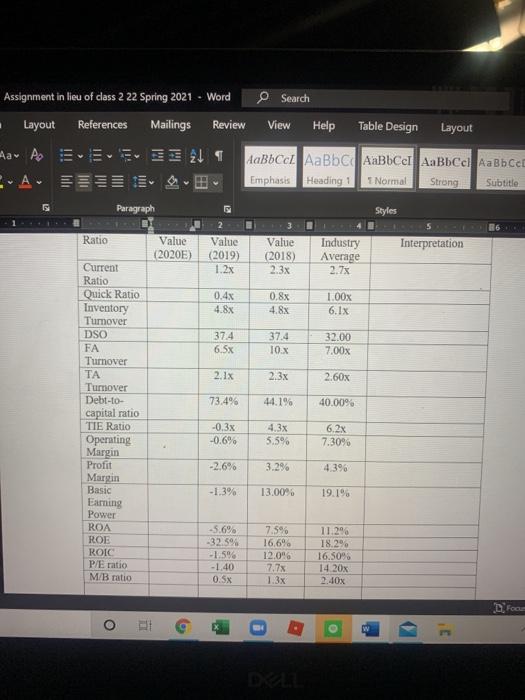
signment in lieu of class 2 22 Spring 2021 - Word Search Justi Layout References Mailings Review View Help Table Design Layout A x 1 c AaBbc| cer AaBbcel Emphasis Heading 1 1 Normal Strong Subtitle >D w Paragraph Styles 1. Complete the table below using the projected 2020 Balance Sheet and Income Statement for D'I.eon Inc, presented in the Integrated Case for chapter 4 (pp. 144-146) of your textbook. For "Interpretation". I'm looking for an evaluation of whether or not the story being told by the ratio is positive or negative for the company. Some might be mixed stories. If so, explain why. Ratio Value (2020) Interpretation Value (2019) 1.2x Value (2018) 2.3x Industry Average 2.7x 0.4x 4.8x 0.8x 4.8x 1.00% 6.1 x Current Ratio Quick Ratio Inventory Turnover DSO FA Turnover TA Turnover Debt-to- capital ratio TIE Ratio Operating 37.4 6.5x 37.4 10.X 32.00 7.00x 2.1 x 2.3x 2.60x 73.4% 44.196 40.00% -0.3x -0.6% 4.3x 5.5% 6.2x 7.3096 O D.FO LA Assignment in lieu of class 2 22 Spring 2021 - Word Layout References Mailings Review Search View Help Table Design Layout Aa A E L 1 bc AaBbcel | Emphasis Heading Normal Strong Subtitle 5 Paragraph Styles 5 Ratio Value (2020E) 2 Value (2019) 1.2x Interpretation Value (2018) 2.3x Industry Average 2.7% 0.8% 0.4x 4.8x Current Ratio Quick Ratio Inventory Turnover DSO FA Turnover 1.00x 6.1x 4.8x 37.4 6.5x 37.4 10.X 32.00 7.00x TA 2.1x 2.3x 2.60x 73.4% 44.1% 40.00% -0.3x -0.6% 6.2x 4.3x 5.5% 7.30% -2.6% 3.29% Tumover Debt-to- capital ratio TIE Ratio Operating Margin Profit Margin Basic Earning Power ROA ROE ROIC P/E ratio M/B ratio -1.3% 13.00 19.1% -5.6% -32.5% -1.5% -1.40 0.5x 7.5% 16.6% 12.0" 17.7% 11.29 18.2% 16.50% 14 20% 2.40x DF o signment in lieu of class 2 22 Spring 2021 - Word Search Justi Layout References Mailings Review View Help Table Design Layout A x 1 c AaBbc| cer AaBbcel Emphasis Heading 1 1 Normal Strong Subtitle >D w Paragraph Styles 1. Complete the table below using the projected 2020 Balance Sheet and Income Statement for D'I.eon Inc, presented in the Integrated Case for chapter 4 (pp. 144-146) of your textbook. For "Interpretation". I'm looking for an evaluation of whether or not the story being told by the ratio is positive or negative for the company. Some might be mixed stories. If so, explain why. Ratio Value (2020) Interpretation Value (2019) 1.2x Value (2018) 2.3x Industry Average 2.7x 0.4x 4.8x 0.8x 4.8x 1.00% 6.1 x Current Ratio Quick Ratio Inventory Turnover DSO FA Turnover TA Turnover Debt-to- capital ratio TIE Ratio Operating 37.4 6.5x 37.4 10.X 32.00 7.00x 2.1 x 2.3x 2.60x 73.4% 44.196 40.00% -0.3x -0.6% 4.3x 5.5% 6.2x 7.3096 O D.FO LA Assignment in lieu of class 2 22 Spring 2021 - Word Layout References Mailings Review Search View Help Table Design Layout Aa A E L 1 bc AaBbcel | Emphasis Heading Normal Strong Subtitle 5 Paragraph Styles 5 Ratio Value (2020E) 2 Value (2019) 1.2x Interpretation Value (2018) 2.3x Industry Average 2.7% 0.8% 0.4x 4.8x Current Ratio Quick Ratio Inventory Turnover DSO FA Turnover 1.00x 6.1x 4.8x 37.4 6.5x 37.4 10.X 32.00 7.00x TA 2.1x 2.3x 2.60x 73.4% 44.1% 40.00% -0.3x -0.6% 6.2x 4.3x 5.5% 7.30% -2.6% 3.29% Tumover Debt-to- capital ratio TIE Ratio Operating Margin Profit Margin Basic Earning Power ROA ROE ROIC P/E ratio M/B ratio -1.3% 13.00 19.1% -5.6% -32.5% -1.5% -1.40 0.5x 7.5% 16.6% 12.0" 17.7% 11.29 18.2% 16.50% 14 20% 2.40x DF o