Answered step by step
Verified Expert Solution
Question
1 Approved Answer
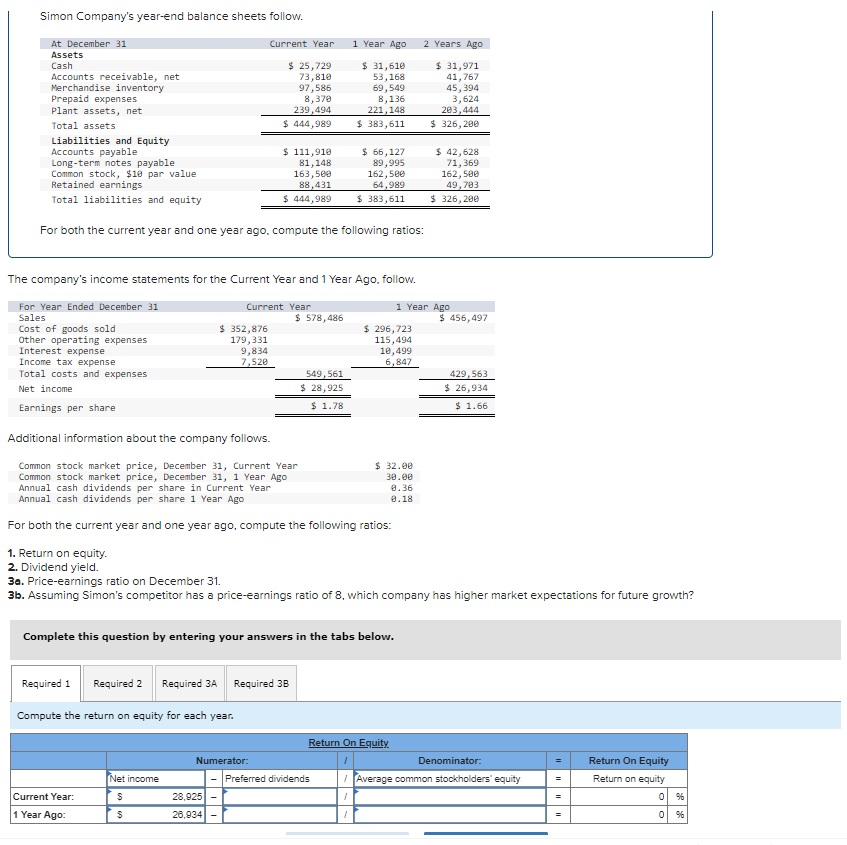
Simon Company's year-end balance sheets follow. At December 31 Assets Cash Accounts receivable, net Merchandise inventory Prepaid expenses Plant assets, net Total assets Liabilities

Simon Company's year-end balance sheets follow. At December 31 Assets Cash Accounts receivable, net Merchandise inventory Prepaid expenses Plant assets, net Total assets Liabilities and Equity Accounts payable Long-term notes payable Common stock, $10 par value Retained earnings Total liabilities and equity Current Year 1 Year Ago 2 Years Ago $ 25,729 73,810 $ 31,610 53,168 97,586 8,370 239,494 $ 444,989 81,148 163,500 88,431 69,549 8,136 221,148 $ 383,611 $ 66,127 89,995 162,500 64,989 $ 31,971 41,767 45,394 3,624 203,444 $ 326,200 $ 42,628 71,369 162,500 49,703 $ 326,200 $ 111,910 $ 444,989 $ 383,611 For both the current year and one year ago, compute the following ratios: The company's income statements for the Current Year and 1 Year Ago, follow. For Year Ended December 31 Sales Cost of goods sold Other operating expenses Interest expense Income tax expense Total costs and expenses Net income Earnings per share Current Year $ 578,486 $ 352,876 179,331 9,834 7,520 Additional information about the company follows. Common stock market price, December 31, Current Year Common stock market price, December 31, 1 Year Ago Annual cash dividends per share in Current Year Annual cash dividends per share 1 Year Ago 1 Year Ago $ 456,497 549,561 $ 28,925 $ 1.78 $ 296,723 115,494 10,499 6,847 429,563 $ 26,934 $ 1.66 $ 32.00 30.00 0.36 For both the current year and one year ago, compute the following ratios: 1. Return on equity. 2. Dividend yield. 30. Price-earnings ratio on December 31. 0.18 3b. Assuming Simon's competitor has a price-earnings ratio of 8, which company has higher market expectations for future growth? Complete this question by entering your answers in the tabs below. Required 1 Required 2 Required 3A Required 3B Compute the return on equity for each year. Numerator: Preferred dividends Net income Current Year: $ 28,925 1 Year Ago: $ 26,934 Return On Equity Denominator: = Return On Equity Average common stockholders' equity = Return on equity = 0% = 0 %
Step by Step Solution
There are 3 Steps involved in it
Step: 1

Get Instant Access to Expert-Tailored Solutions
See step-by-step solutions with expert insights and AI powered tools for academic success
Step: 2

Step: 3

Ace Your Homework with AI
Get the answers you need in no time with our AI-driven, step-by-step assistance
Get Started


