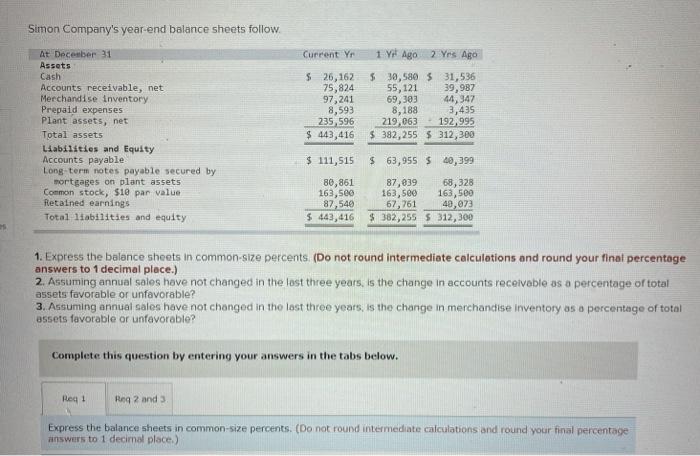
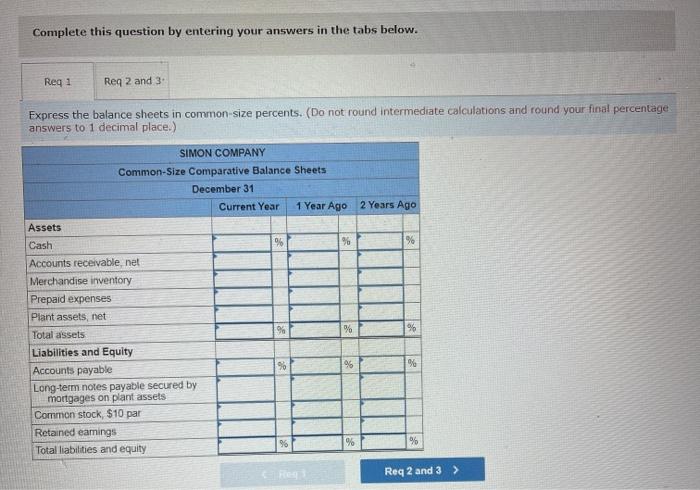
Simon Company's year-end balance sheets follow Current Yr 1 Yr Ago 2 Yes Ago At December 31 Assets Cash Accounts receivable, net Merchandise Inventory Prepaid expenses Plant assets, net Total assets Liabilities and Equity Accounts payable Long-term notes payable secured by mortgages on plant assets Common stock, $10 par value Retained earnings Total liabilities and equity $ 26,162 75,824 97,241 8,593 235 596 $ 443,416 $ 30,580 5 31,536 55,121 39,987 69,303 44,347 8,188 3,435 219,063 192,995 $ 382,255 5 312,200 $ 111,515 $ 63,955 $ 40,399 80,861 163,500 87,540 5443,416 87,839 68,328 163,500 163,500 67,761 40,072 $ 382,255 S 312,300 25 1. Express the balance sheets in common-size percents (Do not round intermediate calculations and round your final percentage answers to 1 decimal place.) 2. Assuming annual sales have not changed in the last three years, is the change in accounts receivable as a percentage of total 3. Assuming annual sales have not changed in the last three years, is the change in merchandise inventory as a percentage of total assets favorable or unfavorable? Complete this question by entering your answers in the tabs below. Regt Reg 2 and Express the balance sheets in common-size percents. (Do not round intermediate calculations and round your final percentage answers to 1 decimal place) Complete this question by entering your answers in the tabs below. Reg 1 Req 2 and 3 Express the balance sheets in common-size percents. (Do not round intermediate calculations and round your final percentage answers to 1 decimal place.) SIMON COMPANY Common-Size Comparative Balance Sheets December 31 Current Year 1 Year Ago 2 Years Ago Assets Cash % % Accounts receivable net Merchandise inventory Prepaid expenses Plant assets, net Total assets % % Liabilities and Equity Accounts payable 9 % % Long-term notes payable secured by mortgages on plant assets Common stock, $10 par Retained earings Total liabilities and equity 96 %% % Req 2 and 3 >