

Answered step by step
Verified Expert Solution
Question
1 Approved Answer
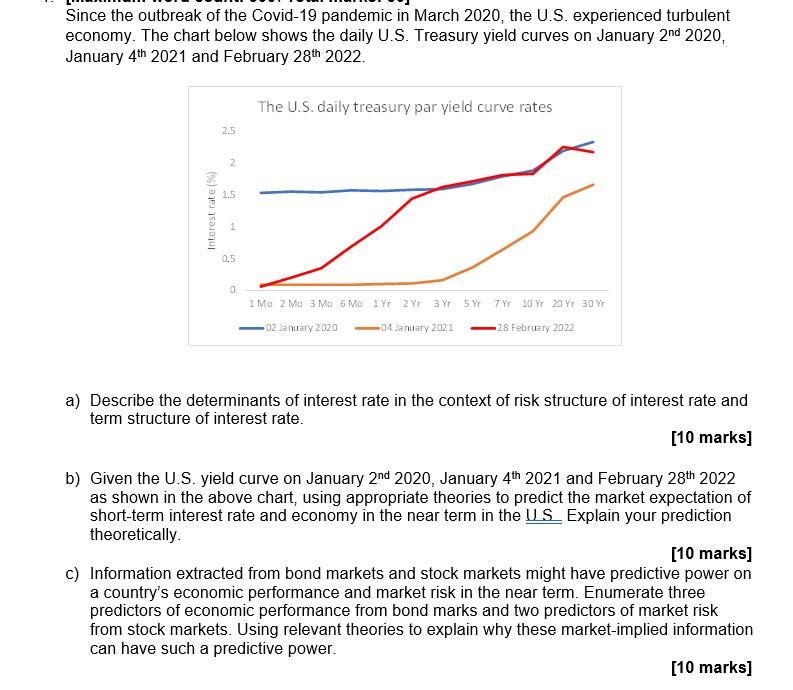
Since the outbreak of the Covid-19 pandemic in March 2020, the U.S. experienced turbulent economy. The chart below shows the daily U.S. Treasury yield curves
Step by Step Solution
There are 3 Steps involved in it
Step: 1

Get Instant Access to Expert-Tailored Solutions
See step-by-step solutions with expert insights and AI powered tools for academic success
Step: 2

Step: 3
Ace Your Homework with AI
Get the answers you need in no time with our AI-driven, step-by-step assistance
Get Started
Public Finance
Authors: Harvey S. Rosen
5th Edition
025617329X, 978-0256173291