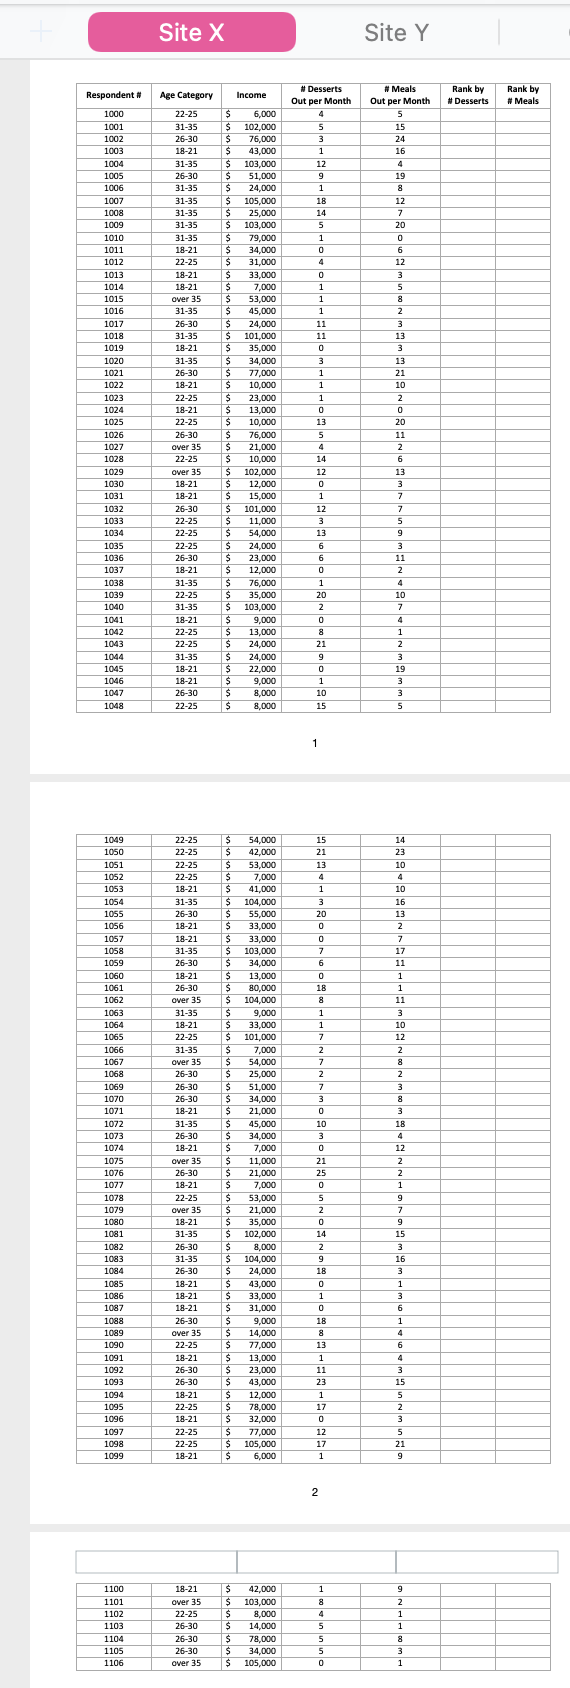
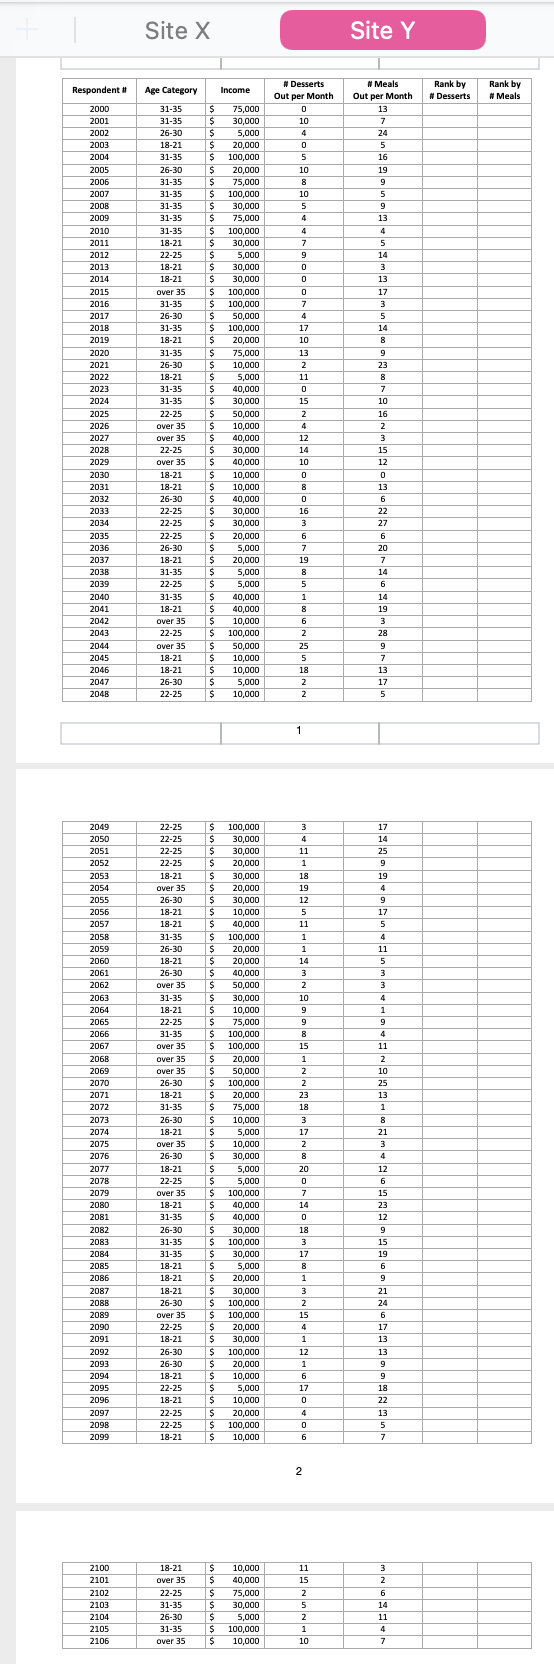
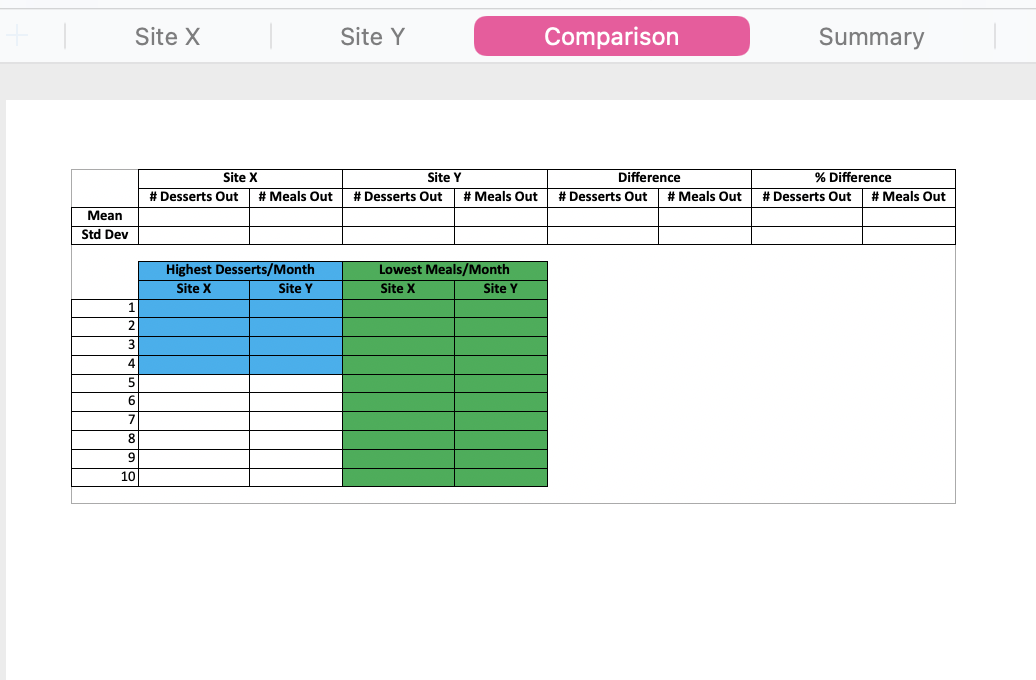
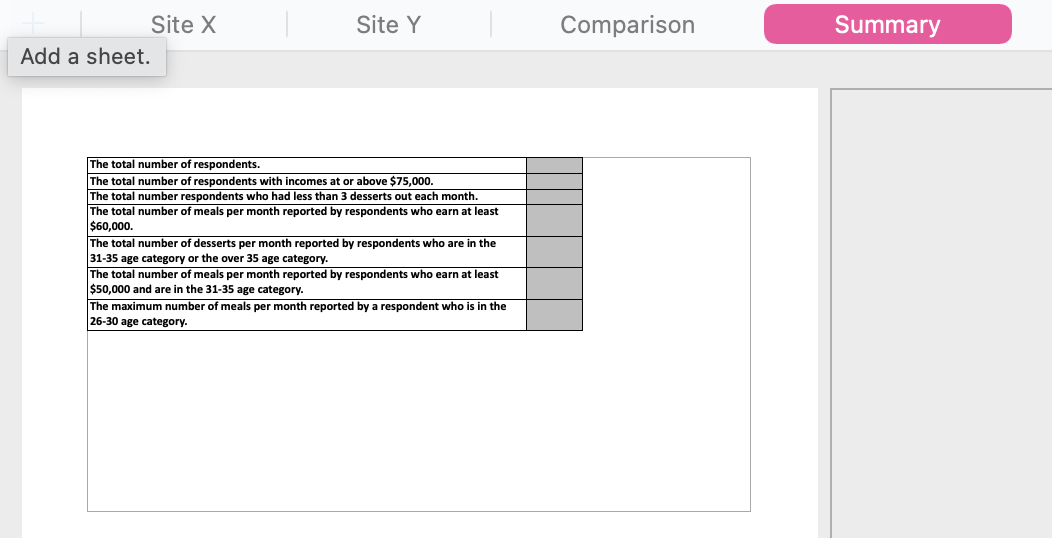
Site X Site Y Respondent # Rank by # Desserts Rank by # Meals # Meals Out per Month 5 15 24 16 4 19 8 12 7 20 0 6 12 # Desserts Out per Month 4 5 3 1 12 9 9 1 1 18 14 5 1 1 0 0 4 0 1 1 1 1 11 11 0 3 1 1 1 1 1 0 13 5 3 5 8 2 3 1000 1001 1002 1003 1004 1005 1006 1007 1008 1009 1010 1011 1012 1013 1014 1015 1016 1017 1018 1019 1020 1021 1022 1023 1024 1025 1026 1027 1028 1029 1030 1031 1032 1033 1034 1035 1036 1037 1038 1039 1040 1041 1042 1043 1044 1045 1046 1047 1048 13 3 3 Age Category Income 22-25 $ 6,000 31-35 $ 102,000 26-30 $ 76,000 18-21 $ 43,000 31-35 $ 103,000 26-30 $ 51,000 31-35 $ 24,000 31-35 $ 105,000 31-35 $ 25,000 31-35 $ 103,000 31-35 $ $ 79,000 18-21 $ 34,000 22-25 $ 31,000 18-21 $ $ 33,000 18-21 $ 7,000 over 35 $ 53,000 31-35 $ 45,000 26-30 $ 24,000 31-35 $ 101,000 18-21 $ 35,000 31-35 $ 34,000 26-30 $ 77,000 18-21 $ 10,000 22-25 $ 23,000 18-21 $ $ 13,000 22-25 $ $ 10,000 26-30 $ 76,000 over 35 $ 21,000 22-25 $ 10,000 over 35 $ 102,000 18-21 $ 12,000 18-21 $ 15,000 26-30 $ 101,000 22-25 $ 11,000 22-25 $ 54,000 22-25 $ 24,000 26-30 $ 23,000 18-21 $ 12,000 31-35 $ 76,000 22-25 $ 35,000 31-35 $ 103,000 18-21 $ 9,000 22-25 $ 13,000 22-25 $ 24,000 31-35 $ 24,000 18-21 $ $ 22,000 18-21 $ 9,000 26-30 $ 8,000 22-25 $ 8,000 4 13 21 10 2 2 0 20 11 2 2 6 13 3 7 7 5 9 3 11 2 14 12 0 1 1 12 3 13 6 6 0 0 1 20 2 0 8 21 9 0 0 1 1 10 15 4 10 7 4 1 2 3 19 3 3 5 5 1 15 21 13 4 1 14 23 10 4 4 10 16 3 13 20 0 0 7 6 0 18 8 1 1 7 2 7 7 2 2 7 3 0 0 10 2 7 17 11 1 1 11 3 10 12 2 8 2 3 3 8 3 18 3 1049 1050 1051 1052 1053 1054 1055 1056 1057 1058 1059 1060 1061 1062 1063 1064 1065 1066 1067 1068 1069 1070 1071 1072 1073 1074 1075 1076 1077 1078 1079 1080 1081 1082 1083 1084 1085 1086 1087 1088 1089 1090 1091 1092 1093 1094 1095 1096 1097 1098 1099 22-25 22-25 22-25 22-25 18-21 31-35 26-30 18-21 18-21 31-35 26-30 18-21 26-30 over 35 31-35 18-21 22-25 31-35 over 35 26-30 26-30 26-30 18-21 31-35 26-30 18-21 over 35 26-30 18-21 22-25 over 35 18-21 31-35 26-30 31-35 26-30 18-21 18-21 18-21 26-30 over 35 22-25 18-21 26-30 26-30 18-21 22-25 18-21 22-25 22-25 18-21 $ $ $ $ $ $ $ $ $ $ $ $ $ $ $ $ $ $ $ $ $ $ $ $ $ $ $ $ $ $ $ $ $ $ $ $ $ $ $ $ $ $ $ $ $ $ $ $ $ $ $ $ $ $ 54,000 42,000 53,000 7,000 41,000 104,000 55,000 33,000 33,000 103,000 34,000 13,000 80,000 104,000 9,000 33,000 101,000 7,000 54,000 25,000 51,000 34,000 21,000 45,000 34,000 7,000 11,000 21,000 7,000 53,000 21,000 35,000 102,000 8,000 104,000 24,000 43,000 33,000 31,000 9.000 14,000 77,000 13,000 23,000 43,000 12,000 78,000 32,000 77,000 105,000 6,000 0 21 25 0 5 2 2 0 0 14 2 9 18 0 1 0 4 12 2 2 2 1 9 7 7 9 15 3 16 3 1 3 6 1 4 6 4 3 18 8 13 1 11 23 1 17 0 12 17 1 15 5 2 3 5 21 9 2 1100 1101 1102 1103 1104 1105 1106 18-21 over 35 22-25 26-30 26-30 26-30 over 35 $ $ $ $ $ $ $ 42,000 103,000 8,000 14,000 78,000 34,000 105,000 1 8 4 5 5 5 5 5 0 0 9 2 1 1 1 8 8 3 1 Site X Site Y Respondent # Age Category Income Rank by # Desserts Rank by # Meals 75,000 30,000 5,000 20,000 100.000 # Desserts Out per Month 0 0 10 4 # Meals Out per Month 13 7 7 24 5 5 16 19 9 5 0 5 10 8 8 10 5 4 9 4 7 7 9 0 0 13 4 5 14 3 13 17 3 5 14 8 8 0 7 4 17 2000 2001 2002 2003 2004 2005 2006 2007 2008 2009 2010 2011 2012 2013 2014 2015 2016 2017 2018 2019 2020 2021 2022 2023 2024 2025 2026 2027 2028 2029 2030 2031 2032 2033 2034 2035 2036 2037 2038 2039 2040 2041 2042 2043 2044 2045 2046 2047 2048 31-35 31-35 26-30 18-21 31-35 26-30 31-35 31-35 31-35 31-35 31-35 18-21 22-25 18-21 18-21 over 35 31-35 26-30 31-35 18-21 31-35 26-30 18-21 31-35 31-35 22-25 over 35 Over 35 22-25 over 35 18-21 18-21 26-30 22-25 22-25 22-25 26-30 18-21 31-35 22-25 31-35 18-21 Over 35 22-25 over 35 18-21 18-21 26-30 22-25 $ $ $ $ $ $ $ $ $ $ $ $ $ $ $ $ $ $ $ $ s $ $ $ $ $ $ $ $ $ $ $ $ $ $ $ $ $ $ s $ $ $ $ $ $ $ $ $ $ $ $ $ $ $ $ 10 13 2 11 0 15 2 2 4 9 23 8 8 7 7 10 20,000 75,000 100,000 30,000 75,000 100,000 30,000 5,000 30,000 30,000 100,000 100,000 50,000 100,000 20,000 75,000 10,000 5,000 40,000 30,000 50,000 10,000 40,000 30,000 40,000 10,000 10,000 40,000 30,000 30,000 20,000 5.000 20,000 5,000 5,000 40,000 40,000 10,000 100.000 50,000 10,000 10,000 5,000 10,000 12 14 10 0 8 0 16 3 6 7 19 8 5 1 8 6 2 2 25 5 18 2 2 16 2 3 15 12 0 13 6 22 27 6 20 7 7 14 6 14 19 3 28 9 7 13 17 5 1 3 4 11 1 18 19 12 5 11 17 14 25 9 19 4 9 17 5 4 11 5 3 3 4 1 1 1 14 3 2 10 9 9 8 15 1 2 2 2 2049 2050 2051 2052 2053 2054 2055 2056 2057 2058 2059 2060 2061 2062 2063 2064 2065 2066 2067 206B 2069 2070 2071 2072 2073 2074 2075 2076 2077 2078 2079 2080 2081 2082 2083 2084 2085 2086 2087 2088 2089 2090 2091 2092 2093 2094 2095 2096 23 18 3 22-25 22-25 22-25 22-25 18-21 over 35 26-30 18-21 18-21 31-35 26-30 18-21 26-30 Over 35 31-35 18-21 22-25 31-35 over 35 over 35 Over 35 26-30 18-21 31-35 26-30 18-21 over 35 26-30 18-21 22-25 over 35 18-21 31-35 26-30 31-35 31-35 18-21 18-21 18-21 26-30 over 35 22-25 18-21 26-30 26-30 18-21 22-25 18-21 22-25 22-25 18-21 $ $ $ $ $ $ $ $ $ $ $ $ $ $ $ $ $ $ $ $ $ $ $ $ $ $ $ $ $ $ $ $ $ $ $ $ $ $ $ $ $ $ $ $ $ $ $ $ $ $ s $ $ $ $ $ 100,000 30,000 30,000 20,000 30,000 20,000 30,000 10,000 40,000 100,000 20,000 20,000 40,000 50,000 30,000 10,000 75,000 100.000 100,000 20,000 50,000 100,000 20,000 75,000 10,000 5,000 10,000 30,000 5,000 5,000 100,000 40,000 40,000 30,000 100,000 30,000 5.000 20,000 30,000 100,000 100,000 20,000 30,000 100,000 20,000 10,000 5.000 10,000 20,000 100,000 10,000 17 2 8 20 0 7 14 0 18 3 9 4 4 11 2 2 10 25 13 1 8 21 3 4 4 12 6 15 23 12 9 15 19 6 9 21 24 6 17 13 13 9 9 18 22 17 8 1 3 2 15 4 1 12 1 6 17 0 0 4 0 6 2097 2098 2099 13 5 7 2 2100 2101 2102 2103 2104 2105 2106 18-21 over 35 22-25 31-35 26-30 31-35 over 35 $ $ $ $ $ $ $ 10,000 40,000 75,000 30,000 5,000 100,000 10,000 11 15 2 5 2 1 10 3 2 6 14 11 4 7 Site X Site Y Comparison Summary Site X # Desserts Out # Meals Out Site Y # Desserts Out # Meals Out Difference # Desserts Out # Meals Out % Difference # Desserts Out # Meals Out Mean Std Dev Highest Desserts/Month Site X Site Y Lowest Meals/Month Site X Site Y 1 2 3 4 5 6 7 8 9 10 Site Y Comparison Summary Site X Add a sheet. The total number of respondents. The total number of respondents with incomes at or above $75,000. The total number respondents who had less than 3 desserts out each month. The total number of meals per month reported by respondents who earn at least $60,000. The total number of desserts per month reported by respondents who are in the 31-35 age category or the over 35 age category. The total number of meals per month reported by respondents who earn at least $50,000 and are in the 31-35 age category. The maximum number of meals per month reported by a respondent who is in the 26-30 age category. You have recently decided to open a restaurant. In your restaurant, you plan to feature specialty desserts along with fine cuisine. One critical decision you must make is where to locate the restaurant. Right now, you are considering two different locations: Site X or Site Y. Before making the decision, you hired a local market research firm to provide you with some demographic data about the two locations and the specific dining habits of the local population that frequent other restaurants in these areas. You now plan to perform some analysis on the data to help you determine which location is more attractive for your new restaurant. 1. Download and save the Excel 3 Template.xlsx file as LastNameFirstNameExcel3.xlsx (e.g. BestMarkExcel3.xlsx). 2. On the Site X and Site Y worksheets, use the RANK.EQ function to rank each respondent by the number of desserts they eat out per month and the number of meals they eat out per month respectively (ranking from most desserts and meals out to the least). Figure Sense: A useful figure sense habit is to ask: "What Excel function is needed to accomplish the required task?". In this case, the Excel function is given: RANK.EQ. After you have identified the required Excel function, determine how to use that function to complete the task for the first respondent Another useful figure sense habit is to check your answers, even when Excel performs the calculations for you! Studies have shown that almost 90% of spreadsheets contain errors, and many mistakes can be spotted quickly by reviewing the output of your formulas and functions. One way to check your answers is to ask: "Does the answer make sense?". If the answer does not make sense, then you may have made a mistake. Another way to check your answer is to calculate the answer by another method and then check to see if you arrived at the same answer both ways. Check that your result from using the RANK.EQ function is correct for Site X by doing the following: (i) Copy columns A through E into the Figure Sense worksheet. (ii) Sort the data based on the # Desserts Out per Month column (largest to smallest). (ii) Determine the respondent who is ranked #1, the respondent who is ranked #2, and the respondent who is ranked #3 in the sorted data. (iv) Check that these three respondents have the same rankings as your result using RANK.EQ. 3. Freeze the top row on the Site X and Site Y worksheets to make the category headings visible at all times. 4. On the Comparison worksheet, calculate the difference and percent difference of the mean and standard deviation for the data sets (Site X and Site Y) for the number of desserts and meals. Use the STDEV.S function for the standard Excel 3 IST 310: Introduction to Information and Management Productivity Systems Page 1 deviation. The difference should be calculated as Site Y - Site X. The percent difference should be calculated as (Site Y - Site X) / Site X. Next, complete the table so that it lists the four highest number of desserts per month from each data set (Site X and Site Y) and the ten lowest number of meals eaten out by respondents for each of the data sets (Site X and Site Y). Figure Sense: What Excel functions are needed to accomplish these tasks? After you have identified the required Excel functions, determine how to use those functions. Is there an easy way to check that your listings of the four highest number of desserts for Sites X and Y are correct? Is there an easy way to check that your listings of the ten lowest number of meals eaten out for Sites X and Y are correct? 5. After looking at the data in the Comparison worksheet, you have decided that Site Y is the more attractive location for your new restaurant. On the Summary worksheet, use various formulas and functions to complete cells B1:B7 using only the data for Site Y. Figure Sense: What Excel functions are needed to accomplish these tasks? How can you use these functions to complete the tasks? One way to check the value for "The total number of meals per month reported by respondents who earn at least $60,000." in cell B4 is the following: (i) Copy columns A through E into the Figure Sense worksheet. (ii) Sort the data based on the Income column (largest to smallest). (ii) with your cursor or keyboard shortcuts, select the range of cells in the # Meals Out per Month column that corresponds to respondents with incomes of at least $60,000. The sum of the selected values will be displayed in the lower part of the workbook window (i.e. in the Status Bar). (iv) Check to see if this value is the same as your computed value in cell B4 in the Summary worksheet. You could use a similar approach (sorting, filtering, etc.) to check that all of the values in cells B1:B7 of the Summary worksheet are correct. 6. Make the Site X tab the active worksheet, save and close your file, and use the Excel 3 link on Blackboard to submit your work. Site X Site Y Respondent # Rank by # Desserts Rank by # Meals # Meals Out per Month 5 15 24 16 4 19 8 12 7 20 0 6 12 # Desserts Out per Month 4 5 3 1 12 9 9 1 1 18 14 5 1 1 0 0 4 0 1 1 1 1 11 11 0 3 1 1 1 1 1 0 13 5 3 5 8 2 3 1000 1001 1002 1003 1004 1005 1006 1007 1008 1009 1010 1011 1012 1013 1014 1015 1016 1017 1018 1019 1020 1021 1022 1023 1024 1025 1026 1027 1028 1029 1030 1031 1032 1033 1034 1035 1036 1037 1038 1039 1040 1041 1042 1043 1044 1045 1046 1047 1048 13 3 3 Age Category Income 22-25 $ 6,000 31-35 $ 102,000 26-30 $ 76,000 18-21 $ 43,000 31-35 $ 103,000 26-30 $ 51,000 31-35 $ 24,000 31-35 $ 105,000 31-35 $ 25,000 31-35 $ 103,000 31-35 $ $ 79,000 18-21 $ 34,000 22-25 $ 31,000 18-21 $ $ 33,000 18-21 $ 7,000 over 35 $ 53,000 31-35 $ 45,000 26-30 $ 24,000 31-35 $ 101,000 18-21 $ 35,000 31-35 $ 34,000 26-30 $ 77,000 18-21 $ 10,000 22-25 $ 23,000 18-21 $ $ 13,000 22-25 $ $ 10,000 26-30 $ 76,000 over 35 $ 21,000 22-25 $ 10,000 over 35 $ 102,000 18-21 $ 12,000 18-21 $ 15,000 26-30 $ 101,000 22-25 $ 11,000 22-25 $ 54,000 22-25 $ 24,000 26-30 $ 23,000 18-21 $ 12,000 31-35 $ 76,000 22-25 $ 35,000 31-35 $ 103,000 18-21 $ 9,000 22-25 $ 13,000 22-25 $ 24,000 31-35 $ 24,000 18-21 $ $ 22,000 18-21 $ 9,000 26-30 $ 8,000 22-25 $ 8,000 4 13 21 10 2 2 0 20 11 2 2 6 13 3 7 7 5 9 3 11 2 14 12 0 1 1 12 3 13 6 6 0 0 1 20 2 0 8 21 9 0 0 1 1 10 15 4 10 7 4 1 2 3 19 3 3 5 5 1 15 21 13 4 1 14 23 10 4 4 10 16 3 13 20 0 0 7 6 0 18 8 1 1 7 2 7 7 2 2 7 3 0 0 10 2 7 17 11 1 1 11 3 10 12 2 8 2 3 3 8 3 18 3 1049 1050 1051 1052 1053 1054 1055 1056 1057 1058 1059 1060 1061 1062 1063 1064 1065 1066 1067 1068 1069 1070 1071 1072 1073 1074 1075 1076 1077 1078 1079 1080 1081 1082 1083 1084 1085 1086 1087 1088 1089 1090 1091 1092 1093 1094 1095 1096 1097 1098 1099 22-25 22-25 22-25 22-25 18-21 31-35 26-30 18-21 18-21 31-35 26-30 18-21 26-30 over 35 31-35 18-21 22-25 31-35 over 35 26-30 26-30 26-30 18-21 31-35 26-30 18-21 over 35 26-30 18-21 22-25 over 35 18-21 31-35 26-30 31-35 26-30 18-21 18-21 18-21 26-30 over 35 22-25 18-21 26-30 26-30 18-21 22-25 18-21 22-25 22-25 18-21 $ $ $ $ $ $ $ $ $ $ $ $ $ $ $ $ $ $ $ $ $ $ $ $ $ $ $ $ $ $ $ $ $ $ $ $ $ $ $ $ $ $ $ $ $ $ $ $ $ $ $ $ $ $ 54,000 42,000 53,000 7,000 41,000 104,000 55,000 33,000 33,000 103,000 34,000 13,000 80,000 104,000 9,000 33,000 101,000 7,000 54,000 25,000 51,000 34,000 21,000 45,000 34,000 7,000 11,000 21,000 7,000 53,000 21,000 35,000 102,000 8,000 104,000 24,000 43,000 33,000 31,000 9.000 14,000 77,000 13,000 23,000 43,000 12,000 78,000 32,000 77,000 105,000 6,000 0 21 25 0 5 2 2 0 0 14 2 9 18 0 1 0 4 12 2 2 2 1 9 7 7 9 15 3 16 3 1 3 6 1 4 6 4 3 18 8 13 1 11 23 1 17 0 12 17 1 15 5 2 3 5 21 9 2 1100 1101 1102 1103 1104 1105 1106 18-21 over 35 22-25 26-30 26-30 26-30 over 35 $ $ $ $ $ $ $ 42,000 103,000 8,000 14,000 78,000 34,000 105,000 1 8 4 5 5 5 5 5 0 0 9 2 1 1 1 8 8 3 1 Site X Site Y Respondent # Age Category Income Rank by # Desserts Rank by # Meals 75,000 30,000 5,000 20,000 100.000 # Desserts Out per Month 0 0 10 4 # Meals Out per Month 13 7 7 24 5 5 16 19 9 5 0 5 10 8 8 10 5 4 9 4 7 7 9 0 0 13 4 5 14 3 13 17 3 5 14 8 8 0 7 4 17 2000 2001 2002 2003 2004 2005 2006 2007 2008 2009 2010 2011 2012 2013 2014 2015 2016 2017 2018 2019 2020 2021 2022 2023 2024 2025 2026 2027 2028 2029 2030 2031 2032 2033 2034 2035 2036 2037 2038 2039 2040 2041 2042 2043 2044 2045 2046 2047 2048 31-35 31-35 26-30 18-21 31-35 26-30 31-35 31-35 31-35 31-35 31-35 18-21 22-25 18-21 18-21 over 35 31-35 26-30 31-35 18-21 31-35 26-30 18-21 31-35 31-35 22-25 over 35 Over 35 22-25 over 35 18-21 18-21 26-30 22-25 22-25 22-25 26-30 18-21 31-35 22-25 31-35 18-21 Over 35 22-25 over 35 18-21 18-21 26-30 22-25 $ $ $ $ $ $ $ $ $ $ $ $ $ $ $ $ $ $ $ $ s $ $ $ $ $ $ $ $ $ $ $ $ $ $ $ $ $ $ s $ $ $ $ $ $ $ $ $ $ $ $ $ $ $ $ 10 13 2 11 0 15 2 2 4 9 23 8 8 7 7 10 20,000 75,000 100,000 30,000 75,000 100,000 30,000 5,000 30,000 30,000 100,000 100,000 50,000 100,000 20,000 75,000 10,000 5,000 40,000 30,000 50,000 10,000 40,000 30,000 40,000 10,000 10,000 40,000 30,000 30,000 20,000 5.000 20,000 5,000 5,000 40,000 40,000 10,000 100.000 50,000 10,000 10,000 5,000 10,000 12 14 10 0 8 0 16 3 6 7 19 8 5 1 8 6 2 2 25 5 18 2 2 16 2 3 15 12 0 13 6 22 27 6 20 7 7 14 6 14 19 3 28 9 7 13 17 5 1 3 4 11 1 18 19 12 5 11 17 14 25 9 19 4 9 17 5 4 11 5 3 3 4 1 1 1 14 3 2 10 9 9 8 15 1 2 2 2 2049 2050 2051 2052 2053 2054 2055 2056 2057 2058 2059 2060 2061 2062 2063 2064 2065 2066 2067 206B 2069 2070 2071 2072 2073 2074 2075 2076 2077 2078 2079 2080 2081 2082 2083 2084 2085 2086 2087 2088 2089 2090 2091 2092 2093 2094 2095 2096 23 18 3 22-25 22-25 22-25 22-25 18-21 over 35 26-30 18-21 18-21 31-35 26-30 18-21 26-30 Over 35 31-35 18-21 22-25 31-35 over 35 over 35 Over 35 26-30 18-21 31-35 26-30 18-21 over 35 26-30 18-21 22-25 over 35 18-21 31-35 26-30 31-35 31-35 18-21 18-21 18-21 26-30 over 35 22-25 18-21 26-30 26-30 18-21 22-25 18-21 22-25 22-25 18-21 $ $ $ $ $ $ $ $ $ $ $ $ $ $ $ $ $ $ $ $ $ $ $ $ $ $ $ $ $ $ $ $ $ $ $ $ $ $ $ $ $ $ $ $ $ $ $ $ $ $ s $ $ $ $ $ 100,000 30,000 30,000 20,000 30,000 20,000 30,000 10,000 40,000 100,000 20,000 20,000 40,000 50,000 30,000 10,000 75,000 100.000 100,000 20,000 50,000 100,000 20,000 75,000 10,000 5,000 10,000 30,000 5,000 5,000 100,000 40,000 40,000 30,000 100,000 30,000 5.000 20,000 30,000 100,000 100,000 20,000 30,000 100,000 20,000 10,000 5.000 10,000 20,000 100,000 10,000 17 2 8 20 0 7 14 0 18 3 9 4 4 11 2 2 10 25 13 1 8 21 3 4 4 12 6 15 23 12 9 15 19 6 9 21 24 6 17 13 13 9 9 18 22 17 8 1 3 2 15 4 1 12 1 6 17 0 0 4 0 6 2097 2098 2099 13 5 7 2 2100 2101 2102 2103 2104 2105 2106 18-21 over 35 22-25 31-35 26-30 31-35 over 35 $ $ $ $ $ $ $ 10,000 40,000 75,000 30,000 5,000 100,000 10,000 11 15 2 5 2 1 10 3 2 6 14 11 4 7 Site X Site Y Comparison Summary Site X # Desserts Out # Meals Out Site Y # Desserts Out # Meals Out Difference # Desserts Out # Meals Out % Difference # Desserts Out # Meals Out Mean Std Dev Highest Desserts/Month Site X Site Y Lowest Meals/Month Site X Site Y 1 2 3 4 5 6 7 8 9 10 Site Y Comparison Summary Site X Add a sheet. The total number of respondents. The total number of respondents with incomes at or above $75,000. The total number respondents who had less than 3 desserts out each month. The total number of meals per month reported by respondents who earn at least $60,000. The total number of desserts per month reported by respondents who are in the 31-35 age category or the over 35 age category. The total number of meals per month reported by respondents who earn at least $50,000 and are in the 31-35 age category. The maximum number of meals per month reported by a respondent who is in the 26-30 age category. You have recently decided to open a restaurant. In your restaurant, you plan to feature specialty desserts along with fine cuisine. One critical decision you must make is where to locate the restaurant. Right now, you are considering two different locations: Site X or Site Y. Before making the decision, you hired a local market research firm to provide you with some demographic data about the two locations and the specific dining habits of the local population that frequent other restaurants in these areas. You now plan to perform some analysis on the data to help you determine which location is more attractive for your new restaurant. 1. Download and save the Excel 3 Template.xlsx file as LastNameFirstNameExcel3.xlsx (e.g. BestMarkExcel3.xlsx). 2. On the Site X and Site Y worksheets, use the RANK.EQ function to rank each respondent by the number of desserts they eat out per month and the number of meals they eat out per month respectively (ranking from most desserts and meals out to the least). Figure Sense: A useful figure sense habit is to ask: "What Excel function is needed to accomplish the required task?". In this case, the Excel function is given: RANK.EQ. After you have identified the required Excel function, determine how to use that function to complete the task for the first respondent Another useful figure sense habit is to check your answers, even when Excel performs the calculations for you! Studies have shown that almost 90% of spreadsheets contain errors, and many mistakes can be spotted quickly by reviewing the output of your formulas and functions. One way to check your answers is to ask: "Does the answer make sense?". If the answer does not make sense, then you may have made a mistake. Another way to check your answer is to calculate the answer by another method and then check to see if you arrived at the same answer both ways. Check that your result from using the RANK.EQ function is correct for Site X by doing the following: (i) Copy columns A through E into the Figure Sense worksheet. (ii) Sort the data based on the # Desserts Out per Month column (largest to smallest). (ii) Determine the respondent who is ranked #1, the respondent who is ranked #2, and the respondent who is ranked #3 in the sorted data. (iv) Check that these three respondents have the same rankings as your result using RANK.EQ. 3. Freeze the top row on the Site X and Site Y worksheets to make the category headings visible at all times. 4. On the Comparison worksheet, calculate the difference and percent difference of the mean and standard deviation for the data sets (Site X and Site Y) for the number of desserts and meals. Use the STDEV.S function for the standard Excel 3 IST 310: Introduction to Information and Management Productivity Systems Page 1 deviation. The difference should be calculated as Site Y - Site X. The percent difference should be calculated as (Site Y - Site X) / Site X. Next, complete the table so that it lists the four highest number of desserts per month from each data set (Site X and Site Y) and the ten lowest number of meals eaten out by respondents for each of the data sets (Site X and Site Y). Figure Sense: What Excel functions are needed to accomplish these tasks? After you have identified the required Excel functions, determine how to use those functions. Is there an easy way to check that your listings of the four highest number of desserts for Sites X and Y are correct? Is there an easy way to check that your listings of the ten lowest number of meals eaten out for Sites X and Y are correct? 5. After looking at the data in the Comparison worksheet, you have decided that Site Y is the more attractive location for your new restaurant. On the Summary worksheet, use various formulas and functions to complete cells B1:B7 using only the data for Site Y. Figure Sense: What Excel functions are needed to accomplish these tasks? How can you use these functions to complete the tasks? One way to check the value for "The total number of meals per month reported by respondents who earn at least $60,000." in cell B4 is the following: (i) Copy columns A through E into the Figure Sense worksheet. (ii) Sort the data based on the Income column (largest to smallest). (ii) with your cursor or keyboard shortcuts, select the range of cells in the # Meals Out per Month column that corresponds to respondents with incomes of at least $60,000. The sum of the selected values will be displayed in the lower part of the workbook window (i.e. in the Status Bar). (iv) Check to see if this value is the same as your computed value in cell B4 in the Summary worksheet. You could use a similar approach (sorting, filtering, etc.) to check that all of the values in cells B1:B7 of the Summary worksheet are correct. 6. Make the Site X tab the active worksheet, save and close your file, and use the Excel 3 link on Blackboard to submit your work