Question
Sketch the graph that has an area of 0.890.89 under the standard normal curve and to the right of the? z-score. Then find the associated?
Sketch the graph that has an area of
0.890.89
under the standard normal curve and to the right of the? z-score. Then find the associated? z-score.
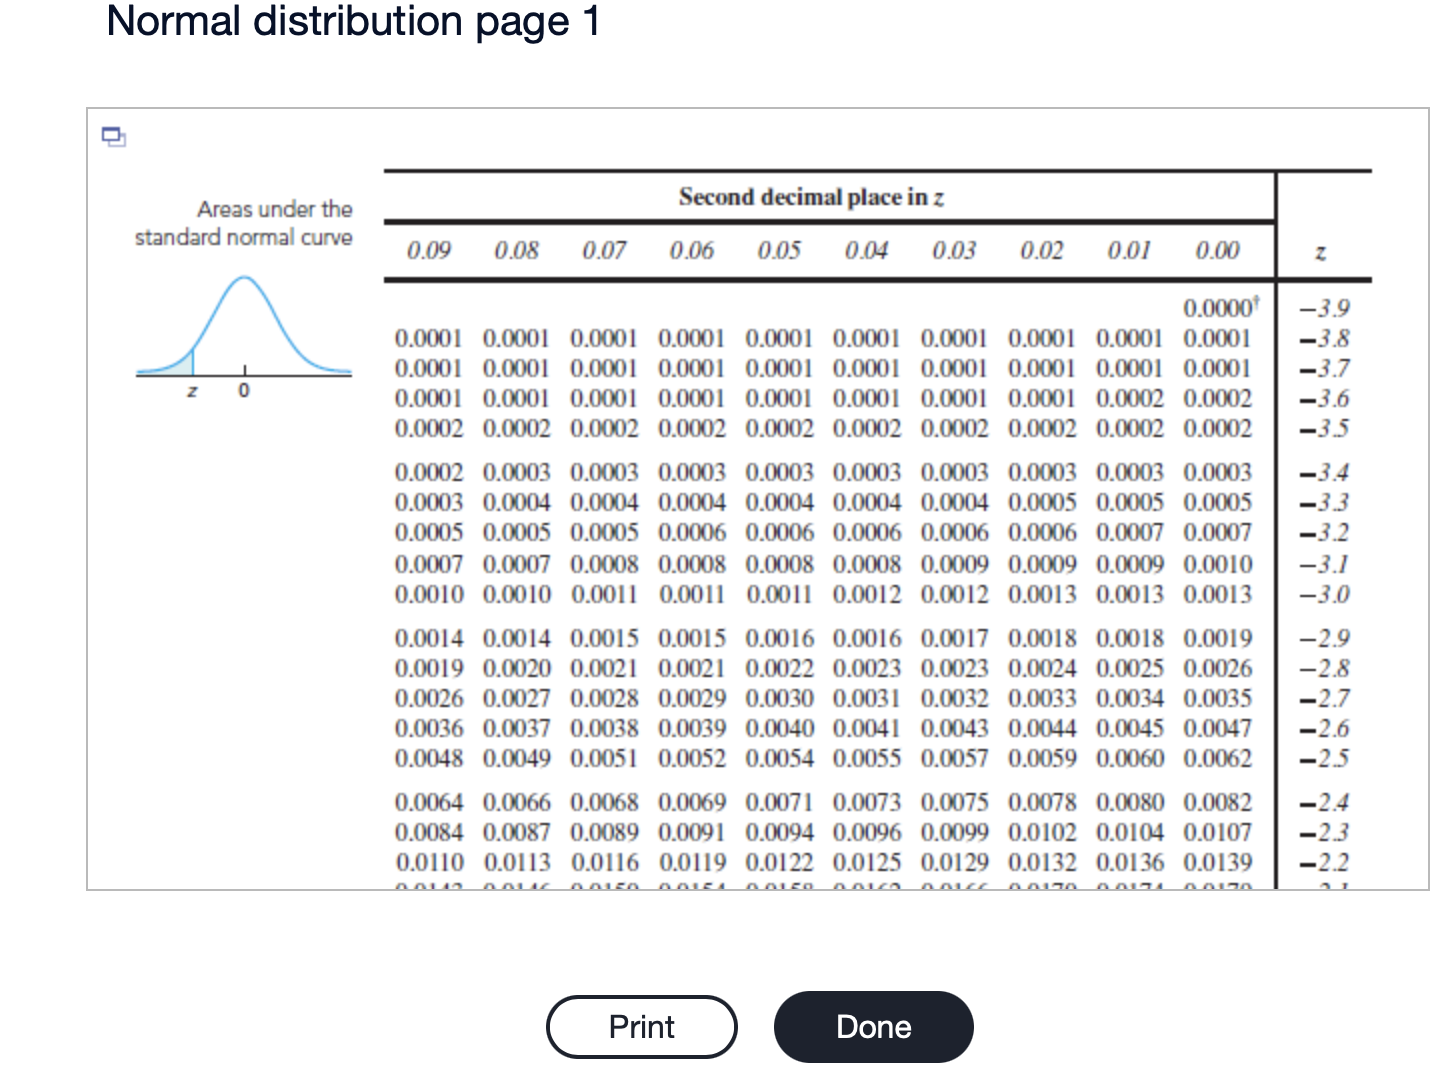
Click here to view page 1 of the normal distribution table.
LOADING...
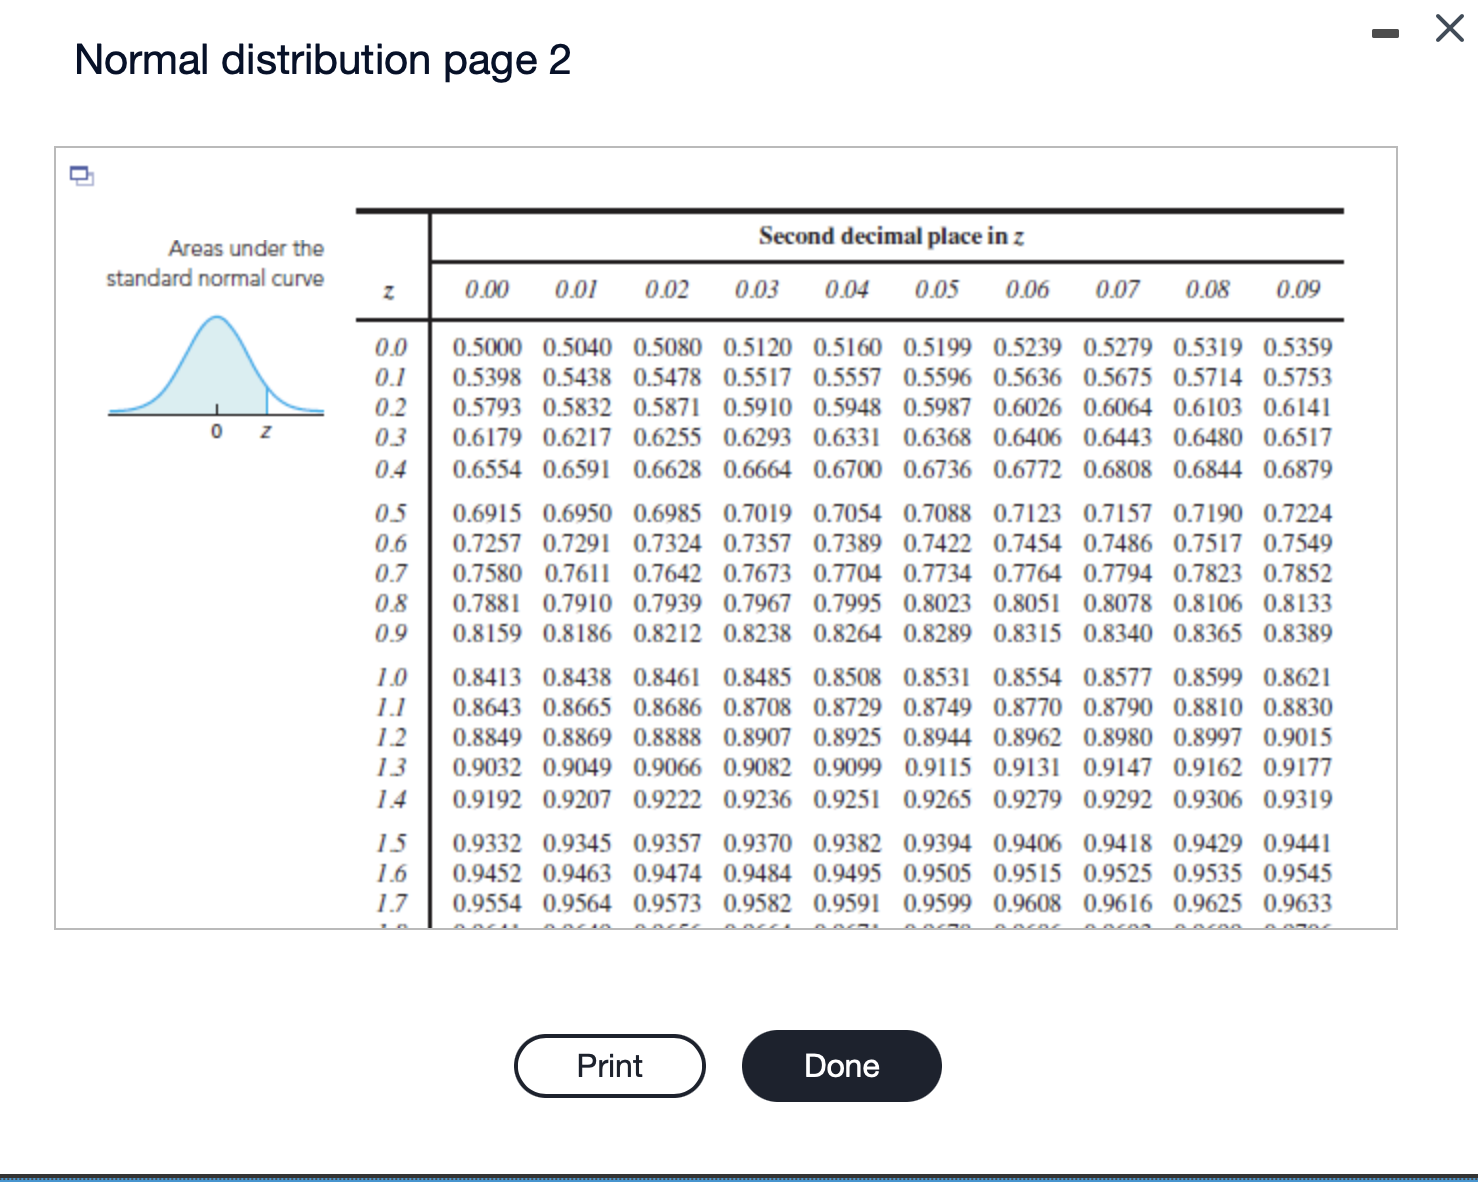
Click here to view page 2 of the normal distribution table.
LOADING...
Question content area bottom
Part 1
Choose the correct graph below.
A.
0zz0.89
A normal curve centered at 0 is over a horizontal z-axis from negative 3 to 3. A vertical line segment labeled z to the right of 0 extends from the horizontal axis to the curve. The area under the curve and to the left of the vertical line segment is shaded and labeled 0.89.
B.
0zz0.89
A normal curve centered at 0 is over a horizontal z-axis from negative 3 to 3. A vertical line segment labeled z to the right of 0 extends from the horizontal axis to the curve. The area under the curve and to the right of the vertical line segment is shaded and labeled 0.89.
C.
0zz0.89
A normal curve centered at 0 is over a horizontal z-axis from negative 3 to 3. A vertical line segment labeled z to the left of 0 extends from the horizontal axis to the curve. The area under the curve and to the right of the vertical line segment is shaded and labeled 0.89.
Your answer is correct.
D.
0z0.89zz
A normal curve centered at 0 is over a horizontal z-axis from negative 3 to 3. Two vertical line segments labeled z to the left and right of 0 extend from the horizontal axis to the curve. The region under the curve and to the left of the vertical line segment to the left of 0 and the region under the curve and to the right of the vertical line segment to the right of 0 are shaded and collectively labeled 0.89.
Part 2
The? z-score that has an area of
0.890.89
under the standard normal curve and to its right is
enter your response here.
?(Round to two decimal places as? needed.)


Step by Step Solution
There are 3 Steps involved in it
Step: 1

Get Instant Access to Expert-Tailored Solutions
See step-by-step solutions with expert insights and AI powered tools for academic success
Step: 2

Step: 3

Ace Your Homework with AI
Get the answers you need in no time with our AI-driven, step-by-step assistance
Get Started


