

Answered step by step
Verified Expert Solution
Question
1 Approved Answer
sklearn jupyther show examples of the steps because cant post data tables Question2:predict the probability of Heart Disease Write and submit your python codes in
sklearn jupyther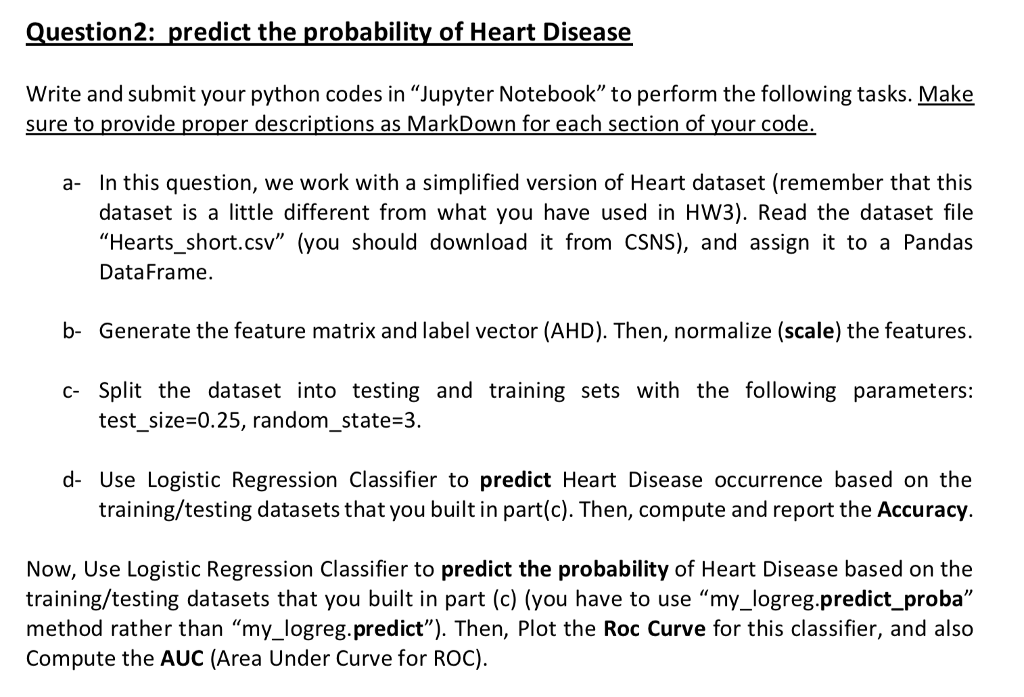

show examples of the steps because cant post data tables
Question2:predict the probability of Heart Disease Write and submit your python codes in "Jupyter Notebook" to perform the following tasks. Make sure to provide proper descriptions as MarkDown for each section of your code In this question, we work with a simplified version of Heart dataset (remember that this dataset is a little different from what you have used in HW3). Read the dataset file "Hearts_short.csv" (you should download it from CSNS), and assign it to a Pandas DataFrame a- b- Generate the feature matrix and label vector (AHD). Then, normalize (scale) the features. c- Split the dataset into testing and training sets with the following parameters: test_size 0.25, random_state-3. d- Use Logistic Regression Classifier to predict Heart Disease occurrence based on the training/testing datasets that you built in part(c). Then, compute and report the Accuracy. Now, Use Logistic Regression Classifier to predict the probability of Heart Disease based on the training/testing datasets that you built in part (c) (you have to use "my_logreg.predict_proba" method rather than "my_logreg.predict"). Then, Plot the Roc Curve for this classifier, and also Compute the AUC (Area Under Curve for ROC) Question2:predict the probability of Heart Disease Write and submit your python codes in "Jupyter Notebook" to perform the following tasks. Make sure to provide proper descriptions as MarkDown for each section of your code In this question, we work with a simplified version of Heart dataset (remember that this dataset is a little different from what you have used in HW3). Read the dataset file "Hearts_short.csv" (you should download it from CSNS), and assign it to a Pandas DataFrame a- b- Generate the feature matrix and label vector (AHD). Then, normalize (scale) the features. c- Split the dataset into testing and training sets with the following parameters: test_size 0.25, random_state-3. d- Use Logistic Regression Classifier to predict Heart Disease occurrence based on the training/testing datasets that you built in part(c). Then, compute and report the Accuracy. Now, Use Logistic Regression Classifier to predict the probability of Heart Disease based on the training/testing datasets that you built in part (c) (you have to use "my_logreg.predict_proba" method rather than "my_logreg.predict"). Then, Plot the Roc Curve for this classifier, and also Compute the AUC (Area Under Curve for ROC)Step by Step Solution
There are 3 Steps involved in it
Step: 1

Get Instant Access to Expert-Tailored Solutions
See step-by-step solutions with expert insights and AI powered tools for academic success
Step: 2

Step: 3
Ace Your Homework with AI
Get the answers you need in no time with our AI-driven, step-by-step assistance
Get Started
Database Processing Fundamentals, Design, and Implementation
Authors: David M. Kroenke, David J. Auer
14th edition
133876705, 9781292107639, 1292107634, 978-0133876703