

Answered step by step
Verified Expert Solution
Question
1 Approved Answer
Solow Growth Model with Population Growth, Steady State, and Transitional Dynamics: Assume that in an economy, output per worker is produced in each period following
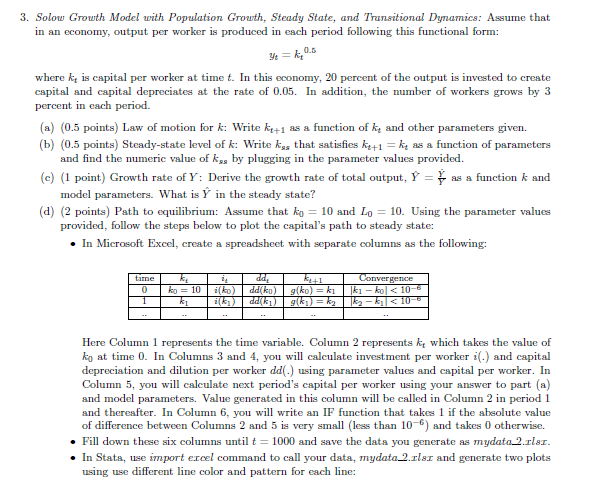 Solow Growth Model with Population Growth, Steady State, and Transitional Dynamics: Assume that in an economy, output per worker is produced in each period following this functional form: yt=kt0.5 where kt is capital per worker at time t. In this economy, 20 percent of the output is invested to create capital and capital depreciates at the rate of 0.05 . In addition, the number of workers grows by 3 percent in each period. (a) (0.5 points) Law of motion for k : Write kt+1 ass a function of kt and other parameters given. (b) (0.5 points) Steady-state level of k : Write ksas that satisfies kt+1=kt as a function of parameters and find the numeric value of ksg by plugging in the parameter values provided. (c) (1 point) Growth rate of Y : Derive the growth rate of total output, Y^=YY^ as a function k and model parameters. What is Y^ in the steady state? (d) (2 points) Path to equilibrium: Assume that k0=10 and L0=10. Using the parameter values provided, follow the steps below to plot the capital's path to steady state: - In Microsoft Excel, create a spreadsheet with separate columns as the following: Here Column 1 represents the time variable. Column 2 represents kt which takes the value of k0 at time 0 . In Columns 3 and 4 , you will calculate investment per worker i(.)andcapital depreciation and dilution per worker dd(.) using parameter values and capital per worker. In Column 5, you will calculate next period's capital per worker using your answer to part (a) and model parameters. Value generated in this column will be called in Column 2 in period 1 and thereafter. In Column 6, you will write an IF function that takes 1 if the absolute value of difference between Columns 2 and 5 is very small (less than 106 ) and takes 0 otherwise. - Fill down these six columns until t=1000 and save the data you generate as mydata_2.xlsx. - In Stata, use import excel command to call your data, mydata_2.xlsx and generate two plots using use different line color and pattern for each line
 Step by Step Solution
There are 3 Steps involved in it
Step: 1

Get Instant Access to Expert-Tailored Solutions
See step-by-step solutions with expert insights and AI powered tools for academic success
Step: 2

Step: 3
Ace Your Homework with AI
Get the answers you need in no time with our AI-driven, step-by-step assistance
Get Started
The Business Strategy Audit
Authors: Vernal Della-Piana, Murray Low, Kendall Lyman
1st Edition
978-0955970740