

Answered step by step
Verified Expert Solution
Question
1 Approved Answer
SOLVE a 5. The Excel worksheet Oxygen_Solubility.xlsx contains temperature, solubility data for oxygen in water. Plot the data. The solubility can be fit to a
SOLVE 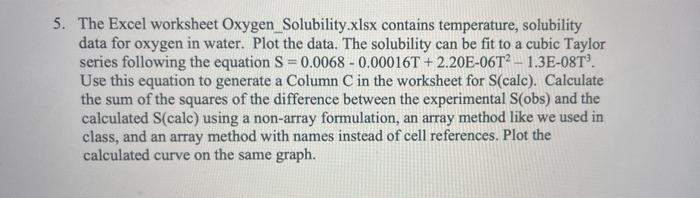
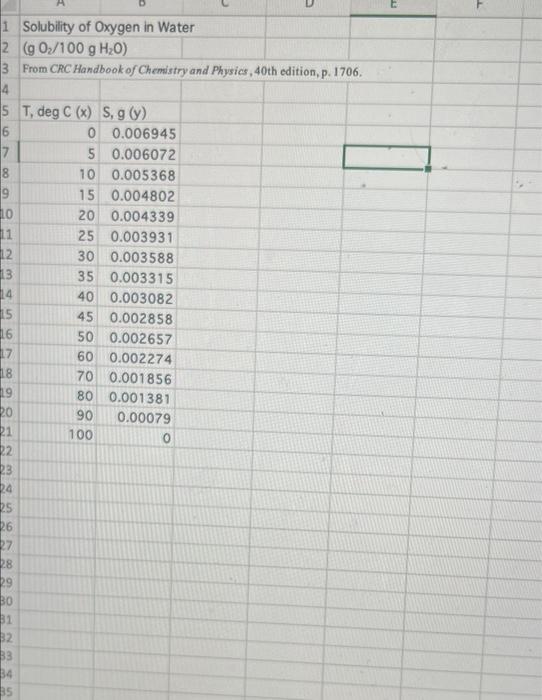
a 5. The Excel worksheet Oxygen_Solubility.xlsx contains temperature, solubility data for oxygen in water. Plot the data. The solubility can be fit to a cubic Taylor series following the equation S=0.0068 -0.00016T + 2.20E-06T2 - 1.3E-08T Use this equation to generate a Column C in the worksheet for S(calc). Calculate the sum of the squares of the difference between the experimental S(obs) and the calculated S(cale) using a non-array formulation, an array method like we used in class, and an array method with names instead of cell references. Plot the calculated curve on the same graph. F 1 Solubility of Oxygen in Water 2 (90/100 g H20) 3 From CRC Handbook of Chemistry and Physics, 40th edition, p. 1706. 4 15 T, deg C (x) S, g(y) 6 0 0.006945 7 5 0.006072 18 10 0.005368 9 15 0.004802 10 20 0.004339 11 25 0.003931 12 30 0.003588 13 35 0.003315 114 40 0.003082 15 45 0.002858 16 50 0.002657 17 60 0.002274 18 70 0.001856 19 80 0.001381 ko 90 0.00079 21 100 0 22 23 24 25 26 27 28 19 $1 32 33 34 15 Step by Step Solution
There are 3 Steps involved in it
Step: 1

Get Instant Access to Expert-Tailored Solutions
See step-by-step solutions with expert insights and AI powered tools for academic success
Step: 2

Step: 3
Ace Your Homework with AI
Get the answers you need in no time with our AI-driven, step-by-step assistance
Get Started
Introduction To Chemical Engineering Analysis Using Mathematica For Chemists Biotechnologists And Materials Scientists
Authors: Henry C. Foley
2nd Edition
0128200510, 978-0128200513