

Answered step by step
Verified Expert Solution
Question
1 Approved Answer
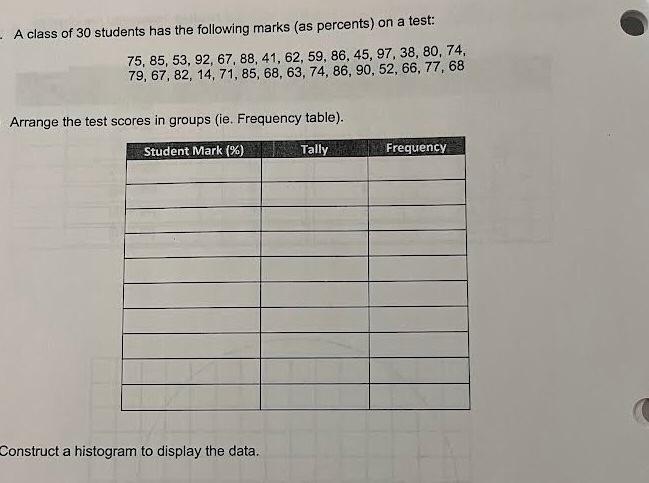
solve all parts. draw graph on squared graph paper A class of 30 students has the following marks (as percents) on a test: 75,85,53,92,67,88,41,62,59,86,45,97,38,80,7479,67,82,14,71,85,68,63,74,86,90,52,66,77,68 Arrange
solve all parts. draw graph on squared graph paper
Step by Step Solution
There are 3 Steps involved in it
Step: 1

Get Instant Access to Expert-Tailored Solutions
See step-by-step solutions with expert insights and AI powered tools for academic success
Step: 2

Step: 3
Ace Your Homework with AI
Get the answers you need in no time with our AI-driven, step-by-step assistance
Get Started
Information Systems Audit In Banking Sector A Study Of SBI And ICICI Banks
Authors: C. Mallesha, M. Sulochana
1st Edition
6200254397, 978-6200254399