Solve all the parts
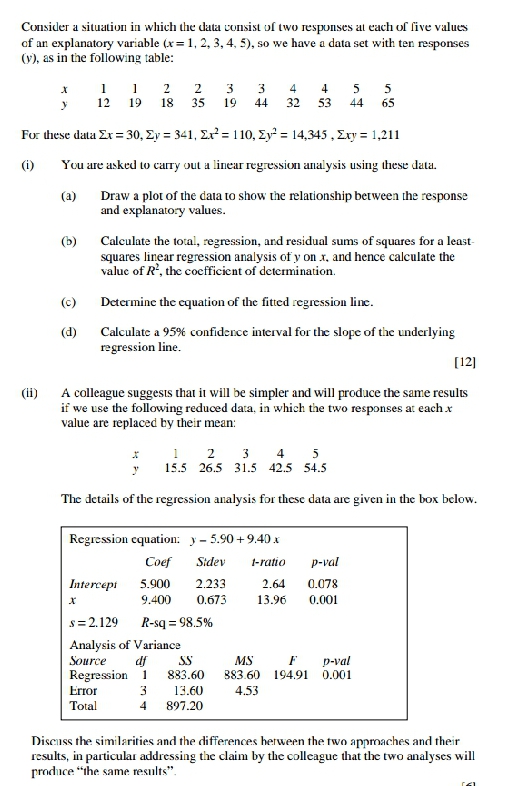
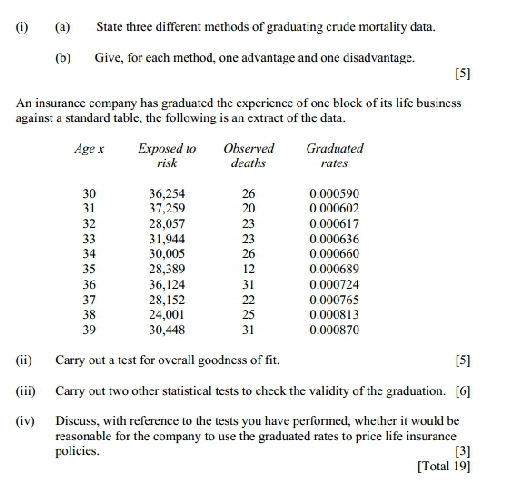
Consider a situation in which the data consist of two responses at each of five values of an explanatory variable (x= 1, 2, 3, 4, 5), so we have a data set with ten responses ()), as in the following table: 2 2 3 4 4 5 12 19 18 35 19 44 32 53 44 65 For these data Ex = 30, Ey = 341, Ex = 110, Zy= = 14,345 , Exy = 1,211 (i) You are asked to carry out a linear regression analysis using these data. (a) Draw a plot of the data to show the relationship between the response and explanatory values. (b) Calculate the total, regression, and residual sums of squares for a least- squares linear regression analysis of y on x. and hence calculate the value of R', the coefficient of determination. (C) Determine the equation of the fitted regression line. (d) Calculate a 95%% confidence interval for the slope of the underlying regression line. [12] (ii) A colleague suggests that it will be simpler and will produce the same results if we use the following reduced data, in which the two responses at each x value are replaced by their mean: 1 2 3 4 5 15.5 26.5 31.5 42.5 54.5 The details of the regression analysis for these data are given in the box below. Regression equation: } - 5.90+9.40.x Coef Sidev t-ratio p-val Intercept 5.900 2.233 2.64 0.078 9.400 0.673 13.96 0.001 $ =2.129 R-sq = 98.5% Analysis of Variance Source di SS MS F p-val Regression 883.60 383 60 194.91 0.001 Error 13.60 4.53 Total 897.20 Discuss the similarities and the differences between the two approaches and their results, in particular addressing the claim by the colleague that the two analyses will produce "the same results".(1) (a) State three different methods of graduating crude mortality data. (b) Give, for each method, one advantage and one disadvantage. [5] An insurance company has graduated the experience of one block of its life business against a standard table. the following is an extract of the data. Age X Exposed to Observed Graduated risk deaths rates 30 36,254 26 0 000590 31 37,259 20 0 000602 32 28,057 23 0 000617 33 31,944 23 0 000636 34 30,005 26 0.000660 35 28,389 12 0 000689 36 36,124 31 0.000724 37 28,152 22 0 000765 38 24,001 25 0.000813 39 30,448 31 0 000870 (ii) Carry out a test for overall goodness of fit. [5] (iii) Carry out two other statistical tests to check the validity of the graduation. [G] (iv) Discuss, with reference to the tests you have performed, whether it would be reasonable for the company to use the graduated rates to price life insurance policies. [3] [Total 19]


