Answered step by step
Verified Expert Solution
Question
1 Approved Answer
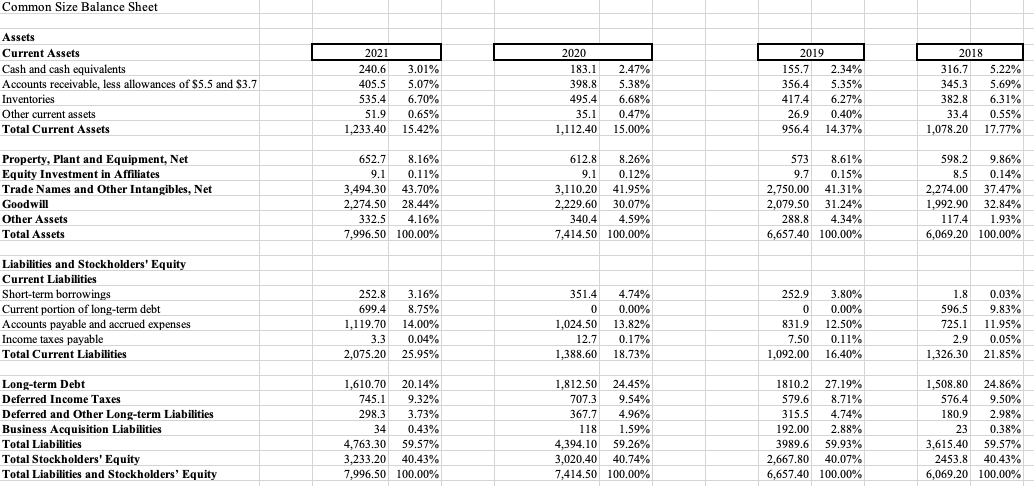
Solve financial ratios? in Excel? Common Size Balance Sheet Assets Current Assets Cash and cash equivalents Accounts receivable, less allowances of $5.5 and $3.7 Inventories


Solve financial ratios? in Excel?
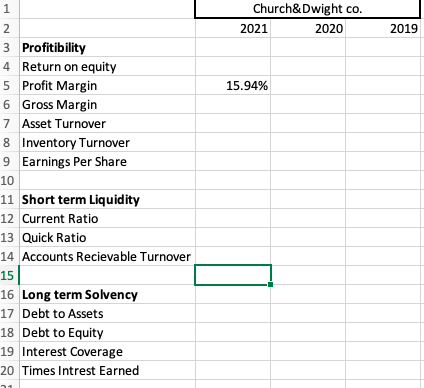
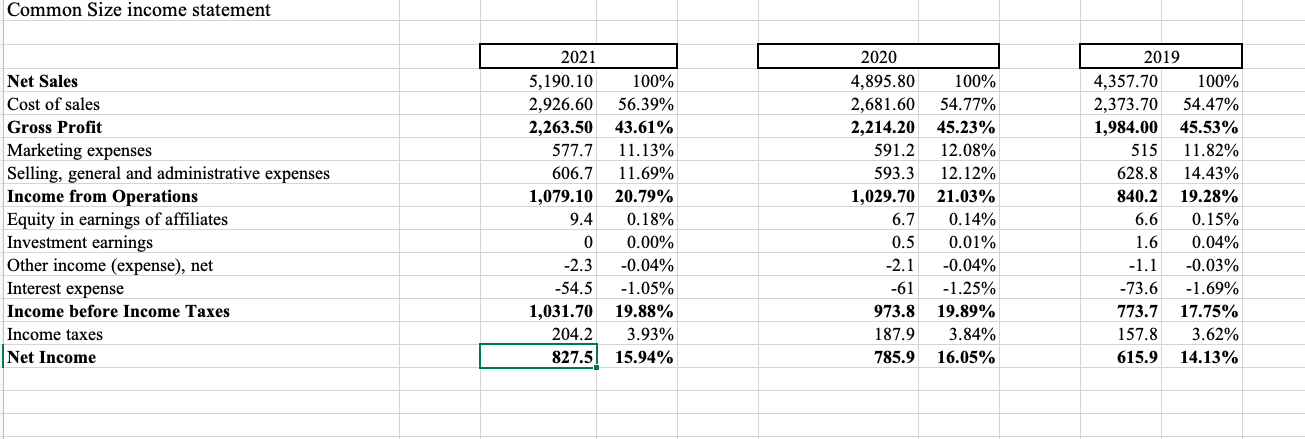
Common Size Balance Sheet Assets Current Assets Cash and cash equivalents Accounts receivable, less allowances of $5.5 and $3.7 Inventories Other current assets Total Current Assets Liabilities and Stockholders' Equity Current Liabilities Short-term borrowings Current portion of long-term debt Accounts payable and accrued expenses Income taxes payable Total Current Liabilities Long-term Debt Deferred Income Taxes Deferred and Other Long-term Liabilities Business Acquisition Liabilities Total Liabilities Total Stockholders' Equity Total Liabilities and Stockholders' Equity \begin{tabular}{|r|r|r|r|} 252.8 & 3.16% & 351.4 & 4.74% \\ \hline 699.4 & 8.75% & 0 & 0.00% \\ \hline 1,119.70 & 14.00% & 1,024.50 & 13.82% \\ \hline 3.3 & 0.04% & 12.7 & 0.17% \\ \hline 2,075.20 & 25.95% & 1,388.60 & 18.73% \\ \hline 1,610.70 & 20.14% & 1,812.50 & 24.45% \\ \hline 745.1 & 9.32% & 707.3 & 9.54% \\ \hline 298.3 & 3.73% & 367.7 & 4.96% \\ \hline 34 & 0.43% & 118 & 1.59% \\ \hline 4,763.30 & 59.57% & 4,394.10 & 59.26% \\ \hline 3,233.20 & 40.43% & 3,020.40 & 40.74% \\ \hline 7,996.50 & 100.00% & 7,414.50 & 100.00% \\ \hline \end{tabular} \begin{tabular}{|r|r|r|r|} \hline 252.9 & 3.80% & 1.8 & 0.03% \\ \hline 0 & 0.00% & 596.5 & 9.83% \\ \hline 831.9 & 12.50% & 725.1 & 11.95% \\ \hline 7.50 & 0.11% & 2.9 & 0.05% \\ \hline 1,092.00 & 16.40% & 1,326.30 & 21.85% \\ \hline 1810.2 & 27.19% & 1,508.80 & 24.86% \\ \hline 579.6 & 8.71% & 576.4 & 9.50% \\ \hline 315.5 & 4.74% & 180.9 & 2.98% \\ \hline 192.00 & 2.88% & 23 & 0.38% \\ \hline 3989.6 & 59.93% & 3,615.40 & 59.57% \\ \hline 2,667.80 & 40.07% & 2453.8 & 40.43% \\ \hline 6,657.40 & 100.00% & 6,069.20 & 100.00% \\ \hline \end{tabular} Church\&Dwight co. 202120202019 Profitibility Return on equity Profit Margin 15.94% Gross Margin Asset Turnover 8 Inventory Turnover Earnings Per Share Short term Liquidity Current Ratio Quick Ratio Accounts Recievable Turnover Long term Solvency Debt to Assets Debt to Equity Interest Coverage Times Intrest Earned Common Size income statement Common Size Balance Sheet Assets Current Assets Cash and cash equivalents Accounts receivable, less allowances of $5.5 and $3.7 Inventories Other current assets Total Current Assets Liabilities and Stockholders' Equity Current Liabilities Short-term borrowings Current portion of long-term debt Accounts payable and accrued expenses Income taxes payable Total Current Liabilities Long-term Debt Deferred Income Taxes Deferred and Other Long-term Liabilities Business Acquisition Liabilities Total Liabilities Total Stockholders' Equity Total Liabilities and Stockholders' Equity \begin{tabular}{|r|r|r|r|} 252.8 & 3.16% & 351.4 & 4.74% \\ \hline 699.4 & 8.75% & 0 & 0.00% \\ \hline 1,119.70 & 14.00% & 1,024.50 & 13.82% \\ \hline 3.3 & 0.04% & 12.7 & 0.17% \\ \hline 2,075.20 & 25.95% & 1,388.60 & 18.73% \\ \hline 1,610.70 & 20.14% & 1,812.50 & 24.45% \\ \hline 745.1 & 9.32% & 707.3 & 9.54% \\ \hline 298.3 & 3.73% & 367.7 & 4.96% \\ \hline 34 & 0.43% & 118 & 1.59% \\ \hline 4,763.30 & 59.57% & 4,394.10 & 59.26% \\ \hline 3,233.20 & 40.43% & 3,020.40 & 40.74% \\ \hline 7,996.50 & 100.00% & 7,414.50 & 100.00% \\ \hline \end{tabular} \begin{tabular}{|r|r|r|r|} \hline 252.9 & 3.80% & 1.8 & 0.03% \\ \hline 0 & 0.00% & 596.5 & 9.83% \\ \hline 831.9 & 12.50% & 725.1 & 11.95% \\ \hline 7.50 & 0.11% & 2.9 & 0.05% \\ \hline 1,092.00 & 16.40% & 1,326.30 & 21.85% \\ \hline 1810.2 & 27.19% & 1,508.80 & 24.86% \\ \hline 579.6 & 8.71% & 576.4 & 9.50% \\ \hline 315.5 & 4.74% & 180.9 & 2.98% \\ \hline 192.00 & 2.88% & 23 & 0.38% \\ \hline 3989.6 & 59.93% & 3,615.40 & 59.57% \\ \hline 2,667.80 & 40.07% & 2453.8 & 40.43% \\ \hline 6,657.40 & 100.00% & 6,069.20 & 100.00% \\ \hline \end{tabular} Church\&Dwight co. 202120202019 Profitibility Return on equity Profit Margin 15.94% Gross Margin Asset Turnover 8 Inventory Turnover Earnings Per Share Short term Liquidity Current Ratio Quick Ratio Accounts Recievable Turnover Long term Solvency Debt to Assets Debt to Equity Interest Coverage Times Intrest Earned Common Size income statementStep by Step Solution
There are 3 Steps involved in it
Step: 1

Get Instant Access to Expert-Tailored Solutions
See step-by-step solutions with expert insights and AI powered tools for academic success
Step: 2

Step: 3

Ace Your Homework with AI
Get the answers you need in no time with our AI-driven, step-by-step assistance
Get Started


