Solve it by python:
======
This is the related question and its answer:
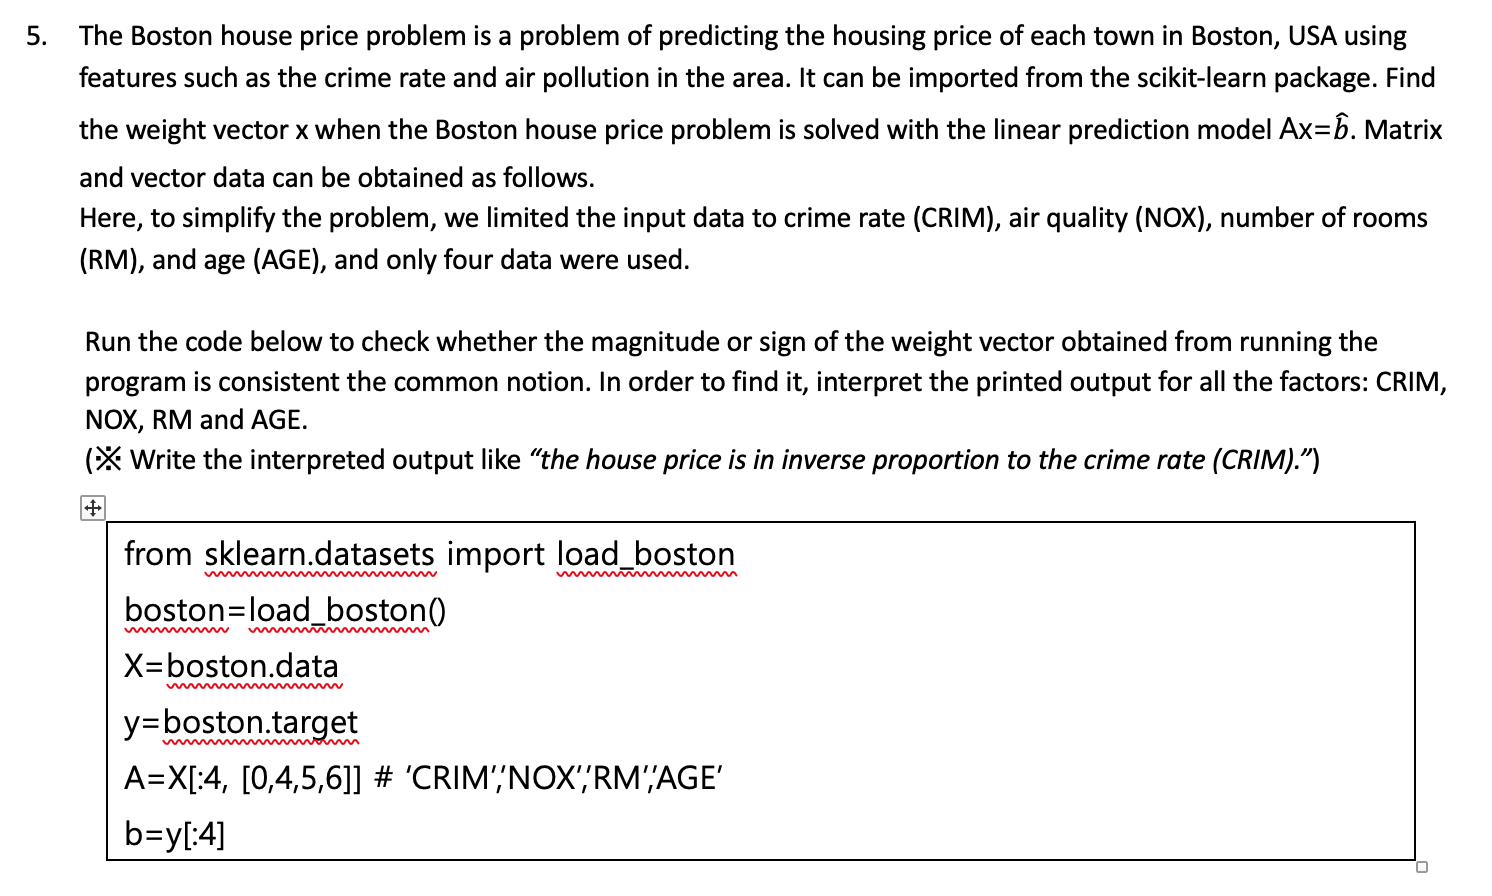
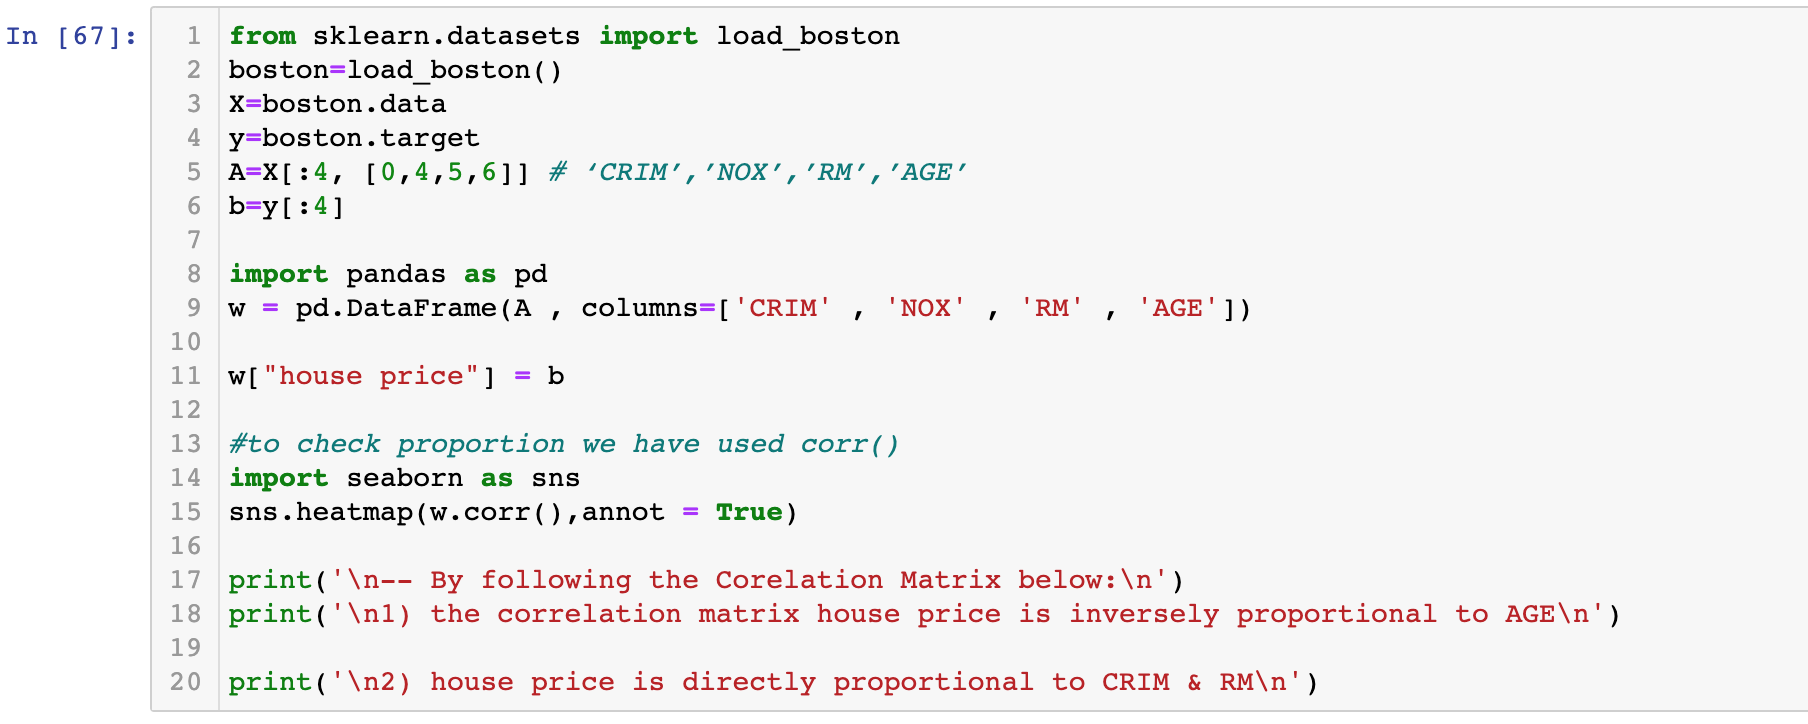
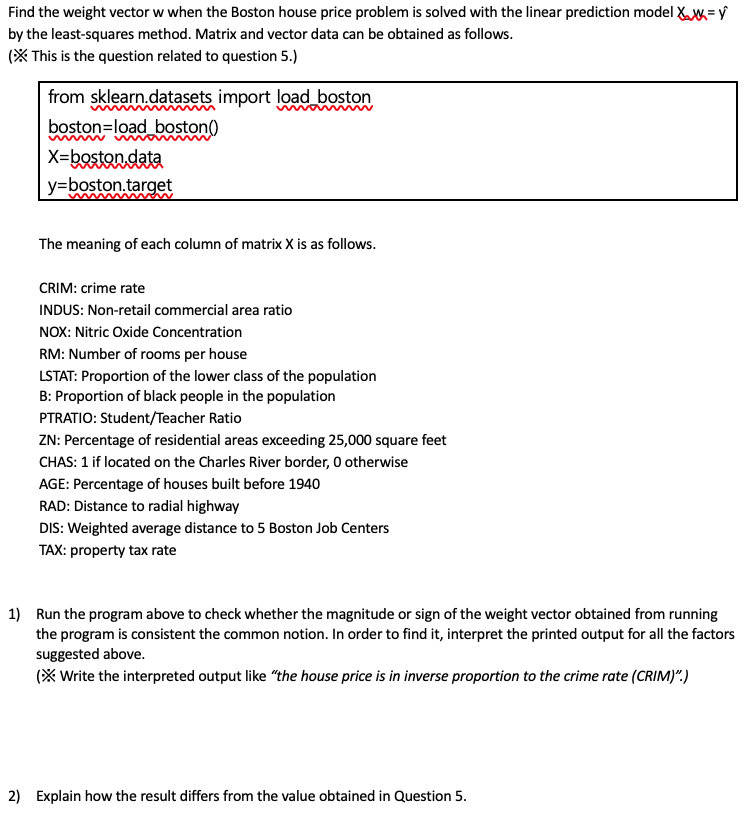
Find the weight vector w when the Boston house price problem is solved with the linear prediction model XX= by the least-squares method. Matrix and vector data can be obtained as follows. (X This is the question related to question 5.) from sklearn.datasets import load boston boston=load boston) X=boston.data y=boston.target The meaning of each column of matrix X is as follows. CRIM: crime rate INDUS: Non-retail commercial area ratio NOX: Nitric Oxide Concentration RM: Number of rooms per house LSTAT: Proportion of the lower class of the population B: Proportion of black people in the population PTRATIO: Student/Teacher Ratio ZN: Percentage of residential areas exceeding 25,000 square feet CHAS: 1 if located on the Charles River border, otherwise AGE: Percentage of houses built before 1940 RAD: Distance to radial highway DIS: Weighted average distance to 5 Boston Job Centers TAX: property tax rate 1) Run the program above to check whether the magnitude or sign of the weight vector obtained from running the program is consistent the common notion. In order to find it, interpret the printed output for all the factors suggested above. (X Write the interpreted output like "the house price is in inverse proportion to the crime rate (CRIM).) 2) Explain how the result differs from the value obtained in Question 5. 5. The Boston house price problem is a problem of predicting the housing price of each town in Boston, USA using features such as the crime rate and air pollution in the area. It can be imported from the scikit-learn package. Find the weight vector x when the Boston house price problem is solved with the linear prediction model Ax=. Matrix and vector data can be obtained as follows. Here, to simplify the problem, we limited the input data to crime rate (CRIM), air quality (NOX), number of rooms (RM), and age (AGE), and only four data were used. Run the code below to check whether the magnitude or sign of the weight vector obtained from running the program is consistent the common notion. In order to find it, interpret the printed output for all the factors: CRIM, NOX, RM and AGE. (X Write the interpreted output like "the house price is in inverse prop rtion to the crime rate (CRIM).") + from sklearn.datasets import load_boston boston=load_boston() X=boston.data y=boston.target A=X[:4, [0,4,5,6]] # 'CRIM''NOX''RM'/AGE' b=y[:4] 0 In [67]: w I 1 from sklearn.datasets import load_boston 2 boston=load_boston() 3 x=boston.data 4 y=boston.target 5 A=X[:4, [0,4,5,6]] # CRIM', 'NOX', 'RM', 'AGE' 6 b=y[:4] 7 8 import pandas as pd 9 pd. DataFrame (A columns=['CRIM' NOX' RM 'AGE']). 10 11 W["house price"] = b 12 13 #to check proportion we have used corr() 14 import seaborn as sns 15 sns.heatmap (w.corr(), annot = True) 16 17 print(' -- By following the corelation Matrix below: ') 18 print(' 1) the correlation matrix house price is inversely proportional to AGE ') 19 20 print(' 2) house price is directly proportional to CRIM & RM ') -- By following the Corelation Matrix below: 1) the correlation matrix house price is inversely proportional to AGE 2) house price is directly proportional to CRIM & RM -100 1 -1 0.45 -0.29 0.51 -0.75 CRIM -0.50 -1 1 0.44 0.24 0.5 XON -0.25 0.45 0.44 1 -0.73 0.99 RM -- 0.00 -0.25 0.29 0.24 0.73 1 -0.8 AGE -0.50 0.51 -0.5 0.99 0.8 1 -0.75 house price 1 CRIM NOX RM AGE house price