

Answered step by step
Verified Expert Solution
Question
1 Approved Answer
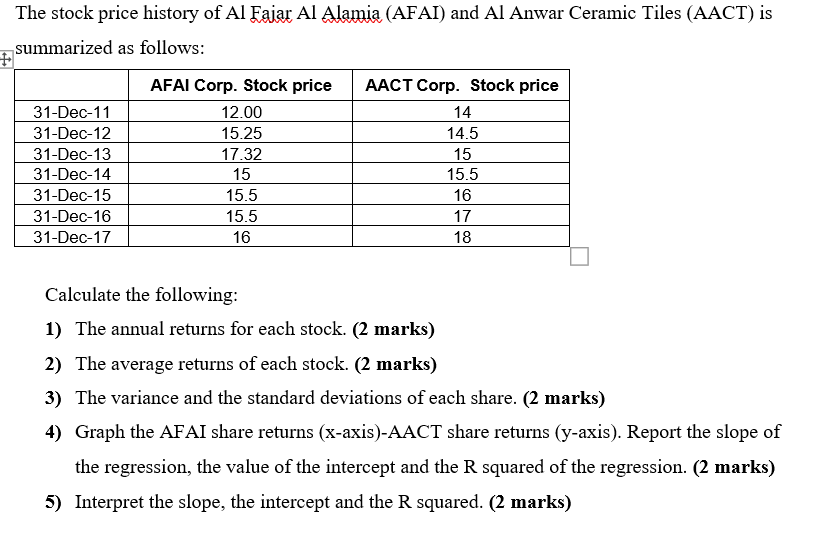
(SOLVE IT IN EXCEL PLEASE) The stock price history of Al Fajar Al Alamia (AFAI) and Al Anwar Ceramic Tiles (AACT) is summarized as follows:
(SOLVE IT IN EXCEL PLEASE)
The stock price history of Al Fajar Al Alamia (AFAI) and Al Anwar Ceramic Tiles (AACT) is summarized as follows: AACT Corp. Stock price 14 31-Dec-11 31-Dec-12 31-Dec-13 31-Dec-14 31-Dec-15 31-Dec-16 31-Dec-17 AFAI Corp. Stock price 12.00 15.25 17.32 15 15.5 15.5 16 14.5 15 15.5 16 17 18 Calculate the following: 1) The annual returns for each stock. (2 marks) 2) The average returns of each stock. (2 marks) 3) The variance and the standard deviations of each share. (2 marks) 4) Graph the AFAI share returns (x-axis)-AACT share returns (y-axis). Report the slope of the regression, the value of the intercept and the R squared of the regression. (2 marks) 5) Interpret the slope, the intercept and the R squared. (2 marks)Step by Step Solution
There are 3 Steps involved in it
Step: 1

Get Instant Access to Expert-Tailored Solutions
See step-by-step solutions with expert insights and AI powered tools for academic success
Step: 2

Step: 3
Ace Your Homework with AI
Get the answers you need in no time with our AI-driven, step-by-step assistance
Get Started
Day Trading Strategies And Risk Management
Authors: Richard N. Williams
1st Edition
979-8863610528