Answered step by step
Verified Expert Solution
Link Copied!

Question

1 Approved Answer

solve question using mathlab with logistic 1.2.4. Using the MATLAB program onepop and many different values for Po, investigate the long-term behavior of the model

solve question using mathlab with logistic
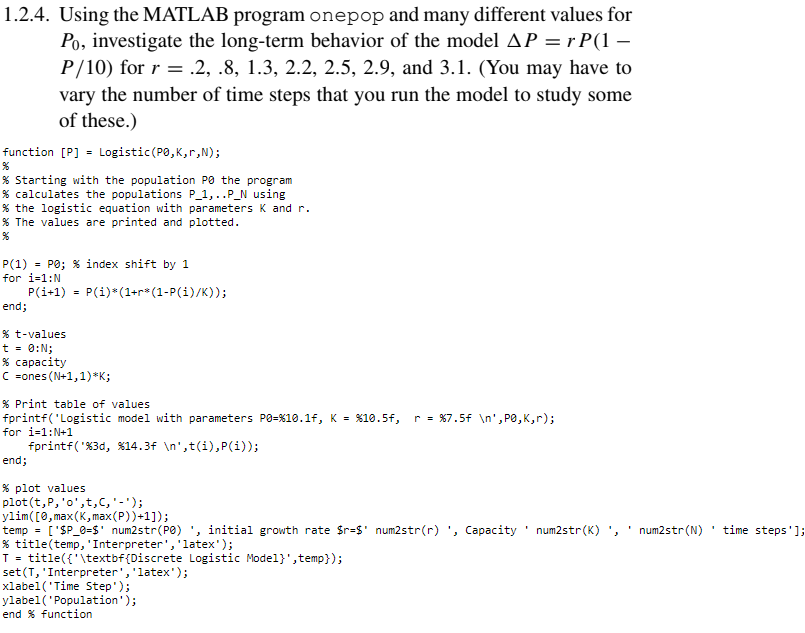
image text in transcribed

1.2.4. Using the MATLAB program onepop and many different values for Po, investigate the long-term behavior of the model AP = r P(1 P/10) for r = .2, .8, 1.3, 2.2, 2.5, 2.9, and 3.1. (You may have to vary the number of time steps that you run the model to study some of these.) function [P] = Logistic(PO,K,r,N); % Starting with the population PO the program % calculates the populations P_1,..P_N using % the logistic equation with parameters K and r. % The values are printed and plotted. P(1) - PO; % index shift by 1 for i=1:N P(i+1) = P(i)*(1+r*(1-P(i)/K)); end; % t-values t = 8:0; % capacity =ones(N+1,1)*K; r = %7.5f ',PO,K,r); % Print table of values fprintf("Logistic model with parameters P0=%10.1f, K = $10.5f, for i=1:N+1 fprintf("%3d, *14.3f ',t(i),P(i)); end; , Capacity 'num2str(K) , 'num2str(N)' time steps']; % plot values plot(t,P,'o',t,c,'-'); ylim([0,max(K,max(P))+1]); temp = ['$P_0=$' num2str(PO) , initial growth rate $r=$' num2str(r) % title(temp, 'Interpreter', 'latex'); T = title({'\textbf{Discrete Logistic Model}', temp}); set(1, 'Interpreter', 'latex'); xlabel('Time Step'); ylabel('Population'); end % function

Step by Step Solution

There are 3 Steps involved in it

Step: 1

blur-text-image

Get Instant Access to Expert-Tailored Solutions

See step-by-step solutions with expert insights and AI powered tools for academic success

Step: 2

blur-text-image

Step: 3

blur-text-image

Ace Your Homework with AI

Get the answers you need in no time with our AI-driven, step-by-step assistance

Get Started

Recommended Textbook for

More Books

Students also viewed these Databases questions