Answered step by step
Verified Expert Solution
Link Copied!

Question

1 Approved Answer

solve the following question The following chart represents the daily recoveries and new cases of Covid-19 of the month of October 2020, in Punjab. Generate

solve the following question
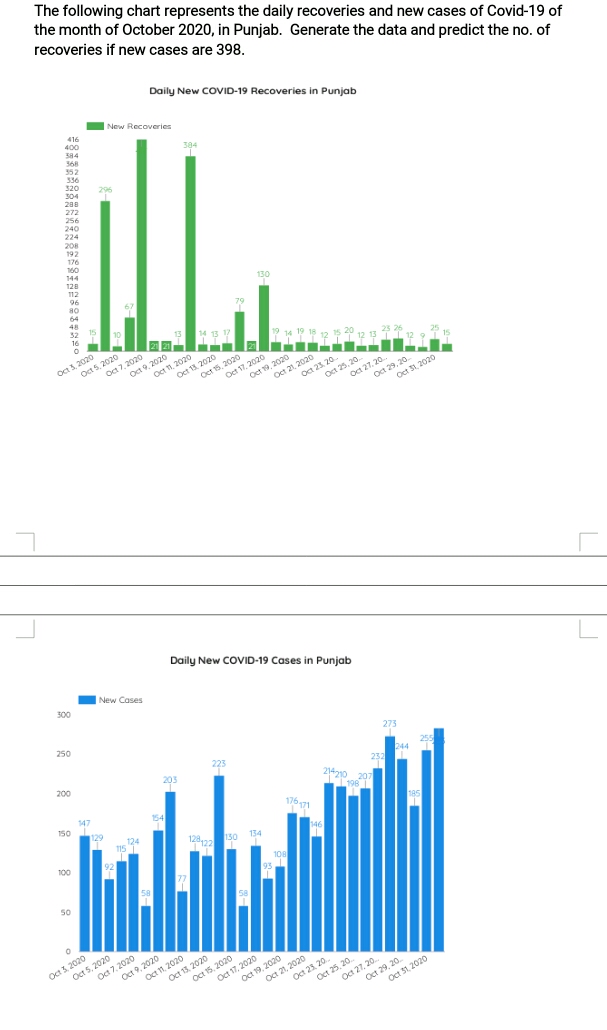
image text in transcribed
The following chart represents the daily recoveries and new cases of Covid-19 of the month of October 2020, in Punjab. Generate the data and predict the no. of recoveries if new cases are 398. Daily New COVID-19 Recoveries in Punjab New Recoveries 416 400 384 536 520 296 BBZ 272 256 240 224 208 192 176 160 144 128 130 112 96 67 79 64 32 16 14 13 17 9 14 19 8 12 65 7 12 13 23 25 12 25 15 Do 3, 2020 Oct 5. 2020 Oct 7. 2020 Oct 9. 2070 Oct 1. 2020 Oct 13 2020 Oct 15. 2020 Oct 17. 2020 Oct 19. 2020 Oct 21. 2020 oct 23 20. Oct 75.20m oct 27.20.. Oct 29, 20. Oct 31, 2020 7 Daily New COVID-19 Cases in Punjab New Cases 300 273 250 25 223 232 203 200 214210 207 176 171 54 12 124 128172 130 134 100 77 50 SO Oct 3, 2020 Oct 5, 2020 Oct 7, 2020 Oct 9, 2020 Oct 11. 2020 Oct 13. 2020 Oct 15. 2020 Oct 17, 2020 Oct 19, 2020 Oct 21, 2020 Oct 23 20. Oct 25. 20. Oct 27. 20. Oct 29. 20. Oct 31, 2020

Step by Step Solution

There are 3 Steps involved in it

Step: 1

blur-text-image

Get Instant Access to Expert-Tailored Solutions

See step-by-step solutions with expert insights and AI powered tools for academic success

Step: 2

blur-text-image_2

Step: 3

blur-text-image_3

Ace Your Homework with AI

Get the answers you need in no time with our AI-driven, step-by-step assistance

Get Started

Recommended Textbook for

Quantitative Analysis For Management

Authors: Barry Render, Ralph M. Stair, Michael E. Hanna

11th Edition

9780132997621, 132149117, 132997622, 978-0132149112

Students also viewed these Mathematics questions