Answered step by step
Verified Expert Solution
Link Copied!

Question

1 Approved Answer

Solve the following questions What are the desired data (requirements) of a good average? Compare the mean, the median and the mode in the light

Solve the following questions

What are the desired data (requirements) of a good average? Compare the mean,

the median and the mode in the light of these desiderata? Why averages are

called measures of central tendency?

2. "Every average has its own peculiar characteristics. It is difficult to say which

average is the best." Explain with examples.

3. What do you understand .by 'Central Tendency'? Under what conditions is the

median more suitable than other measures of central tendency?

4. The average monthly salary paid to all employees in a company was Rs 8,000.

The average monthly salaries paid to male and female employees of the

company were Rs 10,600 and Rs 7,500 respectively. Find out the percentages

of males and females employed by the company.

5. Calculate the arithmetic mean from the following data:

Class 10-19 20-29 30-39 40-49 50-59 60-69 70-79 80-89

Frequency 2 4 9 11 12 6 4 2

6. Calculate the mean, median and mode from the following data:

Height in Inches Number of Persons

62-63 2

63-64 6

64-65 14

65-66 16

66-67 8

67-68 3

68-69 1

Total 50

7. A number of particular articles have been classified according to their weights.

After drying for two weeks, the same articles have again been weighed and

similarly classified. It is known that the median weight in the first weighing 53

was 20.83 gm while in the second weighing it was 17.35 gm. Some

frequencies a and b in the first weighing and x and y in the second are missing.

It is known that a = 1/3x and b = 1/2 y. Find out the values of the missing

frequencies.

Class Frequencies

First Weighing Second Weighing

0- 5 a z

5-10 b y

10-15 11 40

15-20 52 50

20-25 75 30

25-30 22 28

8 Cities A, Band C are equidistant from each other. A motorist travels from A to

B at 30 km/h; from B to C at 40 km/h and from C to A at 50 km/h. Determine

his average speed for the entire trip.

9 Calculate the harmonic mean from the following data:

Class-Interval 2-4 4-6 6-8 8-10

Frequency 20 40 30 10

10 A vehicle when climbing up a gradient, consumes petrol @ 8 km per litre.

While coming down it runs 12 km per litre. Find its average consumption for

to and fro travel between two places situated at the two ends of 25 Ian long

gradient.
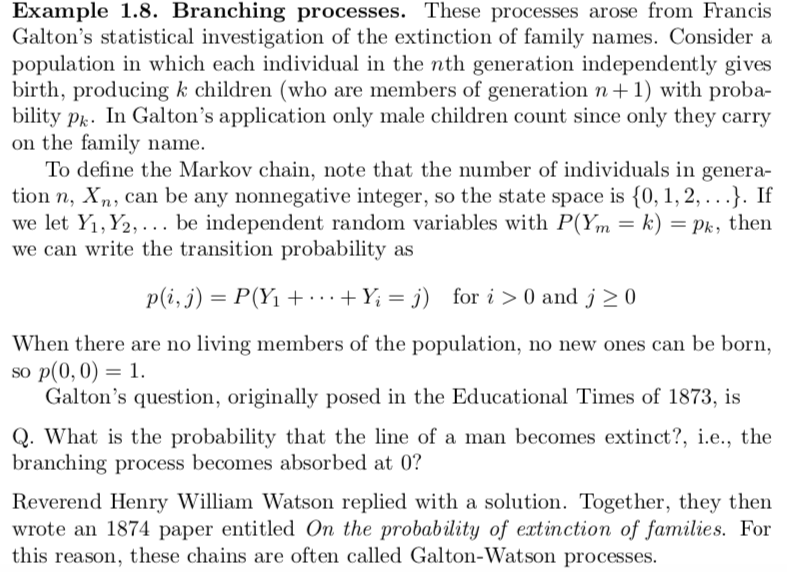
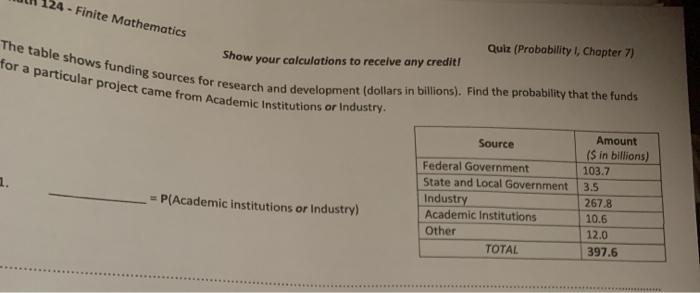
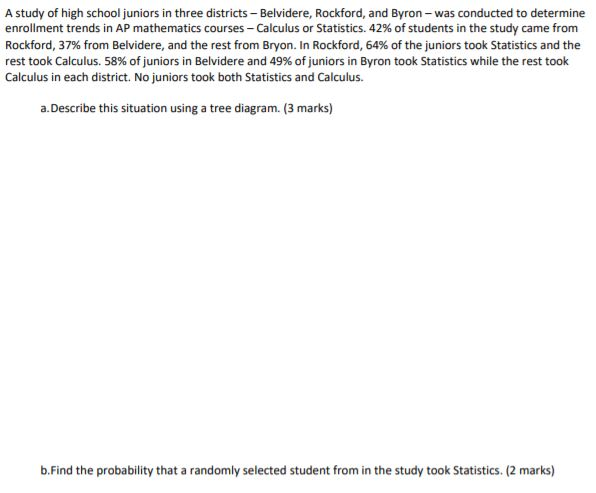
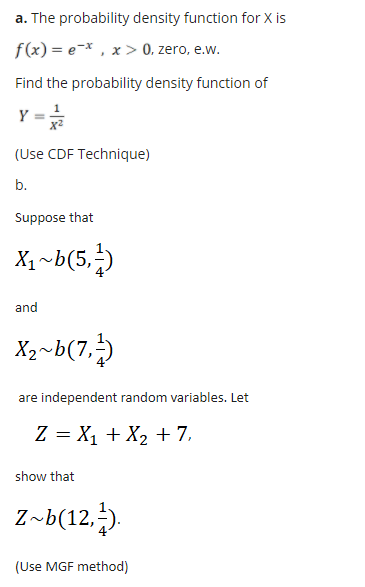
image text in transcribedimage text in transcribedimage text in transcribedimage text in transcribed
Example 1.8. Branching processes. These processes arose from Francis Galton's statistical investigation of the extinction of family names. Consider a population in which each individual in the nth generation independently gives birth, producing k children (who are members of generation n + 1) with proba- bility px. In Galton's application only male children count since only they carry on the family name. To define the Markov chain, note that the number of individuals in genera- tion n, Xn, can be any nonnegative integer, so the state space is {0, 1, 2, . . .}. If we let Y1, Y2, . .. be independent random variables with P(Ym = k) = Pk, then we can write the transition probability as p(i, j) = P(Y1 + . . . + Yi=j) for i > 0 and j 2 0 When there are no living members of the population, no new ones can be born, so p(0, 0) = 1. Galton's question, originally posed in the Educational Times of 1873, is Q. What is the probability that the line of a man becomes extinct?, i.e., the branching process becomes absorbed at 0? Reverend Henry William Watson replied with a solution. Together, they then wrote an 1874 paper entitled On the probability of extinction of families. For this reason, these chains are often called Galton-Watson processes.Finite Mathematics Quiz (Probability I, Chapter 7) Show your calculations to receive any credit! The table shows funding sources for research and development (dollars in billions). Find the probability that the funds for a particular project came from Academic Institutions or Industry. Source Amount ('S in billions) Federal Government 103.7 State and Local Government 3.5 Industry 267.8 = P(Academic institutions or Industry) Academic Institutions 10.6 Other 12.0 TOTAL 397.6A study of high school juniors in three districts - Belvidere, Rockford, and Byron - was conducted to determine enrollment trends in AP mathematics courses - Calculus or Statistics. 42% of students in the study came from Rockford, 37% from Belvidere, and the rest from Bryon. In Rockford, 64%% of the juniors took Statistics and the rest took Calculus. 58% of juniors in Belvidere and 49% of juniors in Byron took Statistics while the rest took Calculus in each district. No juniors took both Statistics and Calculus. a. Describe this situation using a tree diagram. (3 marks) b.Find the probability that a randomly selected student from in the study took Statistics. (2 marks)a. The probability density function for X is f (x) = e-*, x > 0, zero, e.w. Find the probability density function of Y x2 (Use CDF Technique) b. Suppose that X1 ~b(5, -) and X2 ~ b (7, - ) are independent random variables. Let Z =X1 +X2 +7, show that Z ~b(12, 4 (Use MGF method)

Step by Step Solution

There are 3 Steps involved in it

Step: 1

blur-text-image

Get Instant Access to Expert-Tailored Solutions

See step-by-step solutions with expert insights and AI powered tools for academic success

Step: 2

blur-text-image

Step: 3

blur-text-image

Ace Your Homework with AI

Get the answers you need in no time with our AI-driven, step-by-step assistance

Get Started

Recommended Textbook for

More Books

Students also viewed these Mathematics questions