

Question
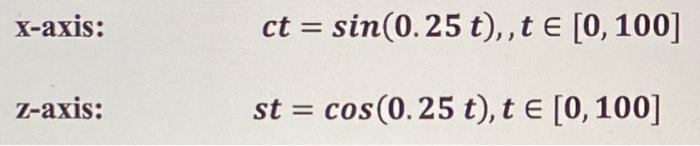
solve using matlab 1. Make a 3d line plot between the functions, where t on the y-axis, use linspace function to define t into 1000
1. Make a 3d line plot between the functions, where t on the y-axis, use linspace function to define t into 1000 points.
Hint: use plot3 function
Step by Step Solution
There are 3 Steps involved in it
Step: 1

Get Instant Access to Expert-Tailored Solutions
See step-by-step solutions with expert insights and AI powered tools for academic success
Step: 2

Step: 3
Ace Your Homework with AI
Get the answers you need in no time with our AI-driven, step-by-step assistance
Get Started
Current Trends In Database Technology Edbt 2006 Edbt 2006 Workshops Phd Datax Iidb Iiha Icsnw Qlqp Pim Parma And Reactivity On The Web Munich Germany March 2006 Revised Selected Papers Lncs 4254
Authors: Torsten Grust ,Hagen Hopfner ,Arantza Illarramendi ,Stefan Jablonski ,Marco Mesiti ,Sascha Muller ,Paula-Lavinia Patranjan ,Kai-Uwe Sattler ,Myra Spiliopoulou ,Jef Wijsen
2006th Edition
3540467882, 978-3540467885