Answered step by step
Verified Expert Solution
Link Copied!

Question

1 Approved Answer

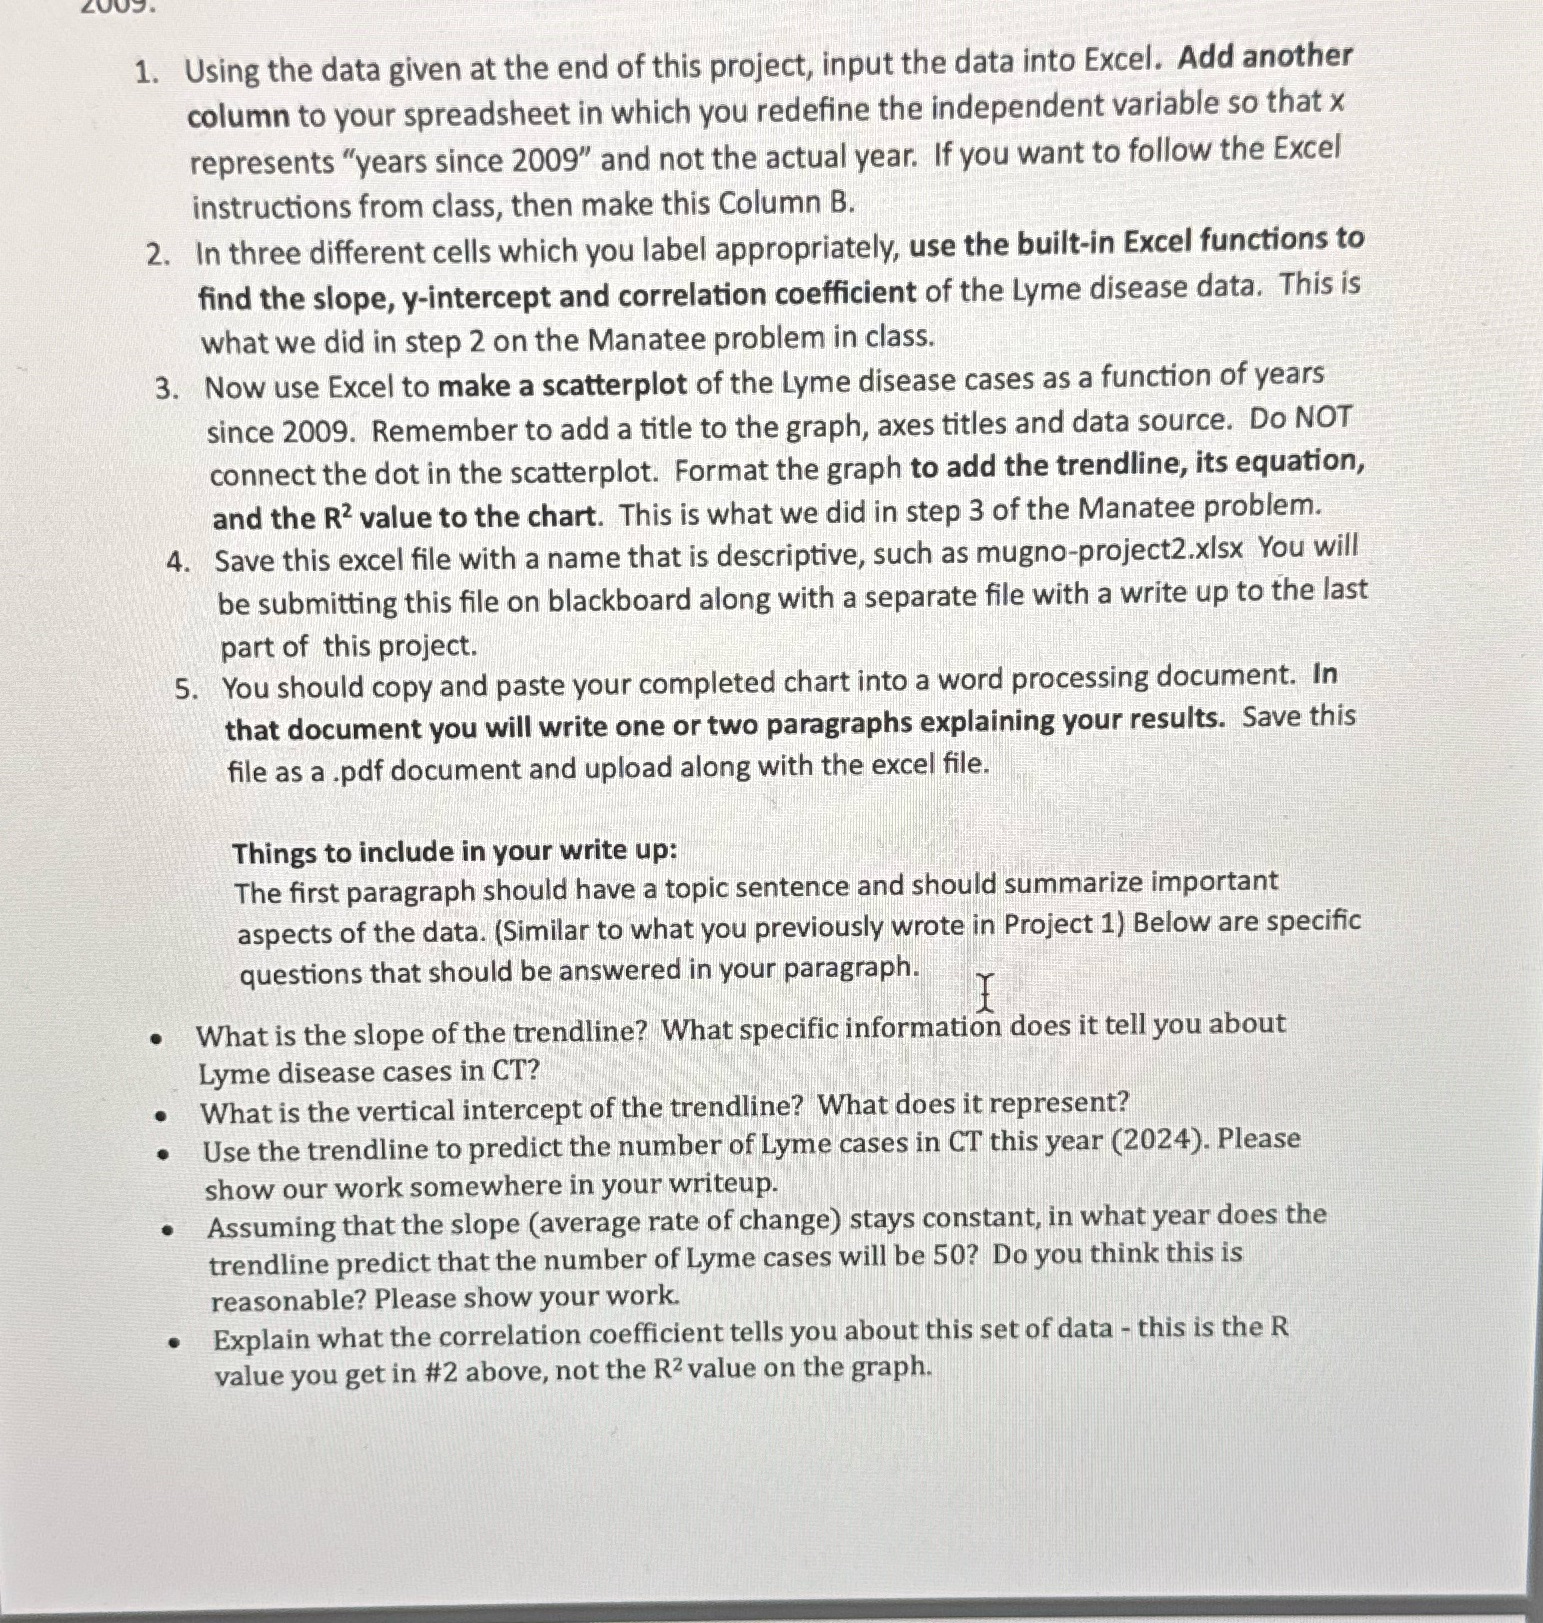
Solve with graph LJVJT . Using the data given at the end of this project, input the data into Excel. Add another column to your

Solve with graph

image text in transcribed
LJVJT . Using the data given at the end of this project, input the data into Excel. Add another column to your spreadsheet in which you redefine the independent variable so that x represents \"years since 2009\" and not the actual year. If you want to follow the Excel instructions from class, then make this Column B. In three different cells which you label appropriately, use the built-in Excel functions to find the slope, y-intercept and correlation coefficient of the Lyme disease data. This is what we did in step 2 on the Manatee problem in class. Now use Excel to make a scatterplot of the Lyme disease cases as a function of years since 2009. Remember to add a title to the graph, axes titles and data source. Do NOT connect the dot in the scatterplot. Format the graph to add the trendline, its equation, and the R? value to the chart. This is what we did in step 3 of the Manatee problem. save this excel file with a name that is descriptive, such as mugno-project2.xlsx You will be submitting this file on blackboard along with a separate file with a write up to the last part of this project. You should copy and paste your completed chart into a word processing document. In that document you will write one or two paragraphs explaining your results. Save this file as a .pdf document and upload along with the excel file. Things to include in your write up: The first paragraph should have a topic sentence and should summarize important aspects of the data. (Similar to what you previously wrote in Project 1) Below are specific questions that should be answered in your paragraph. What is the slope of the trendline? What specific information does it tell you about Lyme disease cases in CT? What is the vertical intercept of the trendline? What does it represent? Use the trendline to predict the number of Lyme cases in CT this year (2024). Please show our work somewhere in your writeup. Assuming that the slope (average rate of change) stays constant, in what year does the trendline predict that the number of Lyme cases will be 507 Do you think this is reasonable? Please show your work. Explain what the correlation coefficient tells you about this set of data - this is the R value you get in #2 above, not the R?value on the graph

Step by Step Solution

There are 3 Steps involved in it

Step: 1

blur-text-image

Get Instant Access to Expert-Tailored Solutions

See step-by-step solutions with expert insights and AI powered tools for academic success

Step: 2

blur-text-image

Step: 3

blur-text-image

Ace Your Homework with AI

Get the answers you need in no time with our AI-driven, step-by-step assistance

Get Started

Recommended Textbook for

An Introduction to Measure Theoretic Probability

Authors: George G. Roussas

2nd edition

128000422, 978-0128000427

More Books

Students also viewed these Mathematics questions